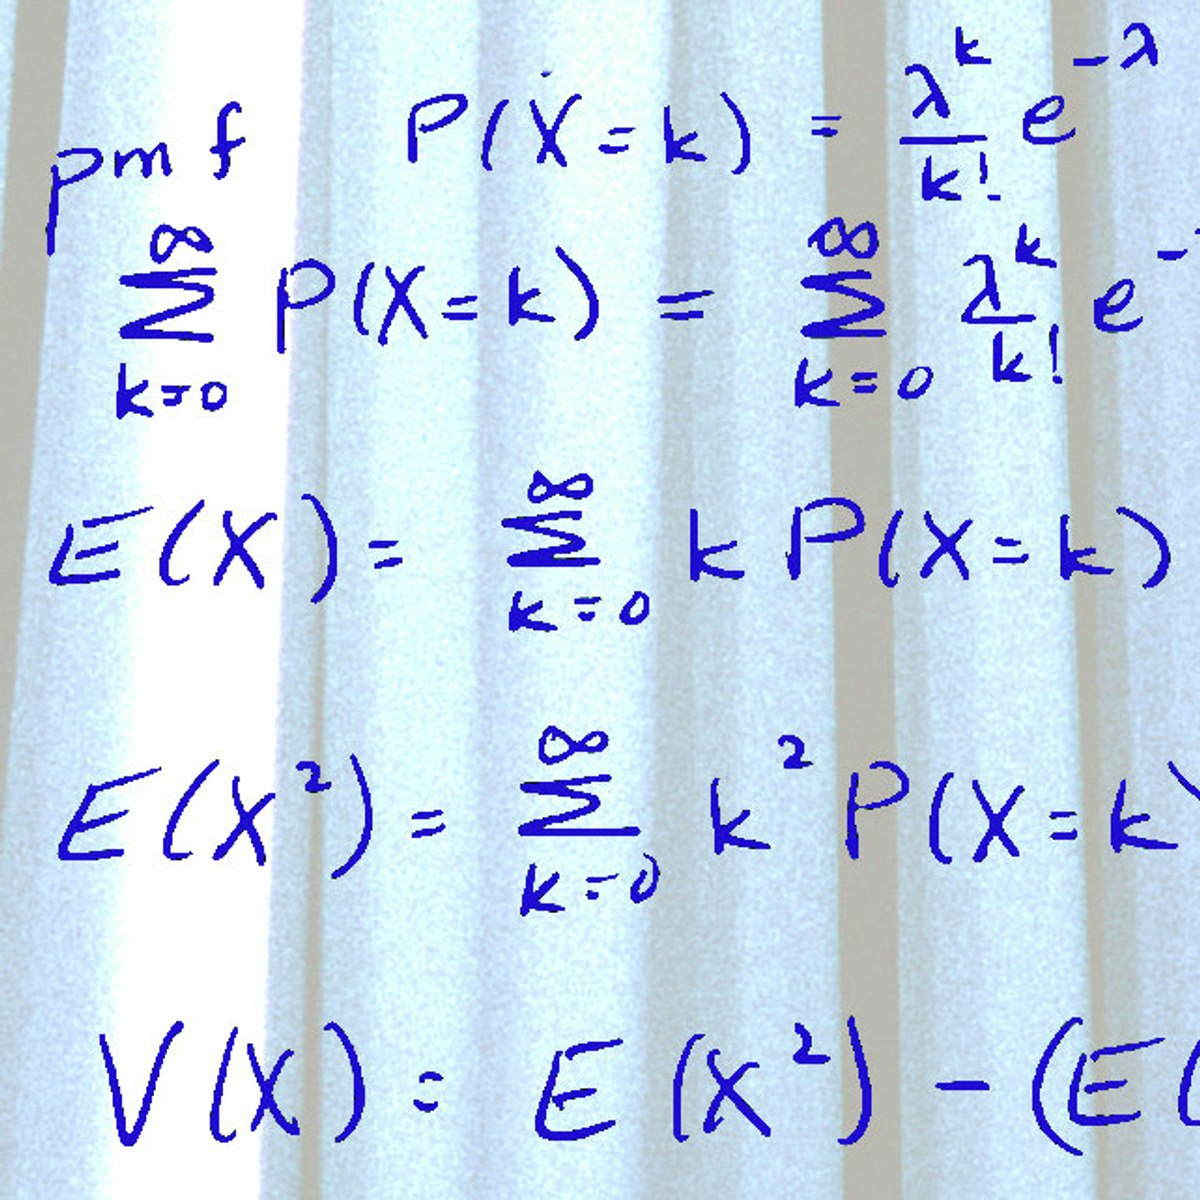
Probability: Types of Distributions
👉🏻 Sign up for Our Complete Data Science Training with 57% OFF: https://bit.ly/31QAkMi
In this lecture we are going to talk about various types of probability distributions and what kind of events they can be used to describe. Certain distributions share features, so we group them into types. Some, like rolling a die or picking a card, have a finite number of outcomes. They follow discrete distributions. Others, like recording time and distance in track & field, have infinitely many outcomes. They follow continuous distributions.
Video Timestamps:
1:29 Discrete Distributions
3:42 Continuous Distributions
We are going to examine the characteristics of some of the most common distributions. For each one we will focus on an important aspect of it or when it is used. Before we get into the specifics, you need to know the proper notation we implement when defining distributions. We start off by writing down the variable name for our set of values, followed by the “tilde” sign. This is superseded by a capital letter depicting the type of the distribution and some characteristics of the dataset in parenthesis. The characteristics are usually, mean and variance but they may vary depending on the type of the distribution. Alright! Let us start by talking about the discrete
ones. We will get an overview of them and then we will devote a separate lecture to each one. So, we looked at problems relating to drawing cards from a deck or flipping a coin. Both examples show events where all outcomes are equally likely. Such outcomes are called equiprobable and
these sorts of events follow a discrete Uniform Distribution. Then there are events with only two possible outcomes – true or false. They follow a Bernoulli Distribution, regardless of whether one outcome is more likely to occur. Any event with two outcomes can be transformed into a Bernoulli event. We simply assign one of them to be “true” and the other one to be “false”. Imagine we are required to elect a captain for
Watch on YouTube ↗
(saves to browser)
Sign in to unlock AI tutor explanation · ⚡30
Playlist
Uploads from 365 Data Science · 365 Data Science · 0 of 60
← Previous
Next →
1
 2
2
 3
3
 4
4
 5
5
 6
6
 7
7
 8
8
 9
9
 10
10
 11
11
 12
12
 13
13
![INDEX and MATCH application of the two functions separately and combined [Advanced Excel]](https://i.ytimg.com/vi/9vrIFfMdYng/mqdefault.jpg) 14
14
![INDIRECT Excel Function: How it works and when to use it [Advanced Excel]](https://i.ytimg.com/vi/kDkS8rNCoBM/mqdefault.jpg) 15
15
![VLOOKUP and MATCH another useful functions combination [Advanced Excel]](https://i.ytimg.com/vi/2435x9FV6qY/mqdefault.jpg) 16
16
![VLOOKUP COLUMN and ROW - Handle large data tables with ease [Advanced Excel]](https://i.ytimg.com/vi/ToUaAqevy9E/mqdefault.jpg) 17
17
![The ELIF keyword [Python Fundamentals]](https://i.ytimg.com/vi/h3Vi9mtw2Jo/mqdefault.jpg) 18
18
 19
19
 20
20
 21
21
 22
22
 23
23
 24
24
 25
25
 26
26
 27
27
 28
28
 29
29
 30
30
 31
31
 32
32
 33
33
 34
34
 35
35
 36
36
 37
37
 38
38
 39
39
 40
40
 41
41
 42
42
 43
43
 44
44
 45
45
 46
46
 47
47
 48
48
 49
49
 50
50
 51
51
 52
52
 53
53
 54
54
 55
55
 56
56
 57
57
 58
58
 59
59
 60
60

Population vs Sample
365 Data Science
Data Science & Statistics: Levels of measurement
365 Data Science
Statistics Tutorials: Mean, median and mode
365 Data Science
Skewness
365 Data Science
What is a distribution?
365 Data Science
The Normal Distribution
365 Data Science
Central limit theorem
365 Data Science
Student's T Distribution
365 Data Science
Type I error vs Type II error
365 Data Science
Hypothesis testing. Null vs alternative
365 Data Science
The linear regression model
365 Data Science
Simple linear regression model. Geometrical representation
365 Data Science
INDEX and MATCH application of the two functions separately and combined [Advanced Excel]
365 Data Science
INDIRECT Excel Function: How it works and when to use it [Advanced Excel]
365 Data Science
VLOOKUP and MATCH another useful functions combination [Advanced Excel]
365 Data Science
VLOOKUP COLUMN and ROW - Handle large data tables with ease [Advanced Excel]
365 Data Science
The ELIF keyword [Python Fundamentals]
365 Data Science
Working with Tuples in Python
365 Data Science
Database Terminology - A Beginners Guide
365 Data Science
Relational Database Essentials
365 Data Science
Database vs Spreadsheet - Advantages and Disadvantages
365 Data Science
Conditional Statements and Loops
365 Data Science
Backpropagation – The Math Behind Optimization
365 Data Science
Monte Carlo: Forecasting Stock Prices Part I
365 Data Science
Monte Carlo: Forecasting Stock Prices Part II
365 Data Science
Monte Carlo: Forecasting Stock Prices Part III
365 Data Science
365 Data Science Online Program
365 Data Science
Data frames - Creating a data frame
365 Data Science
Data Science & Statistics: Slicing a matrix in R
365 Data Science
Data frames in R - Exporting data in R
365 Data Science
Data frames in R - Transforming data PART II
365 Data Science
Data Frames in R - Subsetting a data frame
365 Data Science
Data Science & Statistics: Matrix arithmetic in R
365 Data Science
Data Science & Statistics: Indexing an element from a matrix
365 Data Science
Data Frames in R - Extending a data frame
365 Data Science
Data Science & Statistics: Creating a matrix in R FASTER
365 Data Science
Data Science & Statistics: Creating a Matrix in R
365 Data Science
Data frames - Importing data in R
365 Data Science
Data frames in R - Getting a sense of your data
365 Data Science
Data frames in R - Transforming data PART I
365 Data Science
Data frames in R - Import a CSV in R
365 Data Science
Data Science & Statistics: Matrix operations in R
365 Data Science
Data Science & Statistics: Matrix recycling in R
365 Data Science
Tableau vs Excel: When to use Tableau and when to use Excel
365 Data Science
Download Tableau: Learn how to download Tableau Public
365 Data Science
Connecting data sources: Useful tips when connecting data sources to Tableau
365 Data Science
The Tableau interface: See how to navigate through the Tableau interface
365 Data Science
Tableau data visualization: Create your first Tableau visualization!
365 Data Science
Duplicating sheets: This is how to duplicate a sheet in Tableau
365 Data Science
Build a table in Tableau: The steps needed to create a simple table in Tableau
365 Data Science
Custom fields in Tableau: Using Tableau operators to create custom fields
365 Data Science
Custom fields in Tableau: Add calculations to tables through custom fields
365 Data Science
Totals in Tableau: Learn how to display subtotals and totals in Tableau
365 Data Science
Gross Margin calculation in Tableau
365 Data Science
What is a filter in Tableau: Set up a filter in Tableau to specify the data you want to show
365 Data Science
Joins in Tableau: Inner, outer, left, or a right join in Tableau
365 Data Science
Building a Tableau dashboard: Three types of charts you want to have in a Tableau dashboard
365 Data Science
Creating great looking charts in Tableau: Real life Exercise on charts in Tableau
365 Data Science
Joins in Tableau: Choose the correct join type
365 Data Science
How to make a data check in Tableau: A quick data check is better than no data check
365 Data Science
More on: Probability & Statistics
View skill →


Related AI Lessons
⚡
⚡
⚡
⚡
Vibe Hacking Is Taking Over — And Most Companies Are Completely Unprepared
Medium · AI
La observabilidad de la IA no funciona como la observabilidad tradicional.
Medium · AI
La observabilidad de la IA no funciona como la observabilidad tradicional.
Medium · LLM
Your System Survives
Because That File Hasn’t Failed Yet
Medium · LLM
🎓
Tutor Explanation