Introduction to Probability: Student's T Distribution
Key Takeaways
The video introduces the Student's T Distribution, its characteristics, and how it is used in statistical analysis, particularly in instances with limited data and small sample sizes, as a small sample size approximation of a normal distribution.
Full Transcript
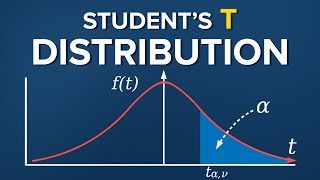
hello folks in this lesson we are going to talk about the student's t-distribution and its characteristics before we begin we use the lowercase letter T to define a student's t-distribution followed by a single parameter in parentheses called degrees of freedom we read this next statement as variable Y follows a student's t-distribution with 3 degrees of freedom as we mentioned in the last video it is a small sample size approximation of a normal distribution in instances where we would assume a normal distribution were it not for the limited number of observations we use the student's t-distribution for instance the average lap times for the entire season of a Formula One race follow a normal distribution but the lap times for the first lap of the Monaco Grand Prix would follow a student's t-distribution now the curve of the student's t-distribution is also bell-shaped and symmetric however it has fatter tails to accommodate the occurrence of values far away from the mean that is because if such a value features in our limited data it would be representing a bigger part of the total another key difference between the students T distribution and the normal one is that apart from the mean and variance we must also define the degrees of freedom for the distribution great job as long as we have at least two degrees of freedom the expected value of a T distribution is the mean mu furthermore the variance of the distribution equals the variance of the sample times the number of degrees of freedom over degrees of freedom minus 2 overall the student's t-distribution is frequently used when conducting statistical analysis it plays a major role when we want to do hypothesis testing with limited data since we also have a table summarizing the most important values of its CDF great another distribution that is commonly used in statistical analysis is the chi-squared distribution in the next video we will explore when we use it and what other distributions it is related to thanks for watching if you found this video interesting and want to gain an edge in your career make sure to LIKE comment and subscribe and don't forget to check out some of our other videos for another quick win in the data science skills department
Original Description
👉Sign up for Our Complete Data Science Training with 57% OFF: https://bit.ly/3sJATc9
👉 Download Our Free Data Science Career Guide: https://bit.ly/47Eh6d5
In this Introduction to Probability video, we’ll talk about the Student’s T Distribution and its characteristics.
For starters, we use the lower-case letter “t” to define a Students’ T distribution, followed by a single parameter in parenthesis, called “degrees of freedom”.
As we mentioned in the last video, it is a small sample size approximation of a Normal Distribution. In instances, where we would assume a Normal distribution were it not for the limited number of observations, we use the Students’ T distribution.
For instance, the average lap times for the entire season of a Formula 1 race follow a Normal Distribution, but the lap times for the first lap of the Monaco Grand Prix would follow a Students’ T distribution.
Now, the curve of the students’ T distribution is also bell-shaped and symmetric. However, it has fatter tails to accommodate the occurrence of values far away from the mean. That is because if such a value features in our limited data, it would be representing a bigger part of the total.
Another key difference between the Students’ T Distribution and the Normal one is that apart from the mean and variance, we must also define the degrees of freedom for the distribution.
► Consider hitting the SUBSCRIBE button if you LIKE the content: https://www.youtube.com/c/365DataScience?sub_confirmation=1
► VISIT our website: https://bit.ly/365ds
🤝 Connect with us LinkedIn: https://www.linkedin.com/company/365datascience/
365 Data Science is an online educational career website that offers the incredible opportunity to find your way into the data science world no matter your previous knowledge and experience. We have prepared numerous courses that suit the needs of aspiring BI analysts, Data analysts and Data scientists.
We at 365 Data Science are committed educators who believe th
Watch on YouTube ↗
(saves to browser)
Sign in to unlock AI tutor explanation · ⚡30
Playlist
Uploads from 365 Data Science · 365 Data Science · 0 of 60
← Previous
Next →
1
 2
2
 3
3
 4
4
 5
5
 6
6
 7
7
 8
8
 9
9
 10
10
 11
11
 12
12
 13
13
![INDEX and MATCH application of the two functions separately and combined [Advanced Excel]](https://i.ytimg.com/vi/9vrIFfMdYng/mqdefault.jpg) 14
14
![INDIRECT Excel Function: How it works and when to use it [Advanced Excel]](https://i.ytimg.com/vi/kDkS8rNCoBM/mqdefault.jpg) 15
15
![VLOOKUP and MATCH another useful functions combination [Advanced Excel]](https://i.ytimg.com/vi/2435x9FV6qY/mqdefault.jpg) 16
16
![VLOOKUP COLUMN and ROW - Handle large data tables with ease [Advanced Excel]](https://i.ytimg.com/vi/ToUaAqevy9E/mqdefault.jpg) 17
17
![The ELIF keyword [Python Fundamentals]](https://i.ytimg.com/vi/h3Vi9mtw2Jo/mqdefault.jpg) 18
18
 19
19
 20
20
 21
21
 22
22
 23
23
 24
24
 25
25
 26
26
 27
27
 28
28
 29
29
 30
30
 31
31
 32
32
 33
33
 34
34
 35
35
 36
36
 37
37
 38
38
 39
39
 40
40
 41
41
 42
42
 43
43
 44
44
 45
45
 46
46
 47
47
 48
48
 49
49
 50
50
 51
51
 52
52
 53
53
 54
54
 55
55
 56
56
 57
57
 58
58
 59
59
 60
60

Population vs Sample
365 Data Science
Data Science & Statistics: Levels of measurement
365 Data Science
Statistics Tutorials: Mean, median and mode
365 Data Science
Skewness
365 Data Science
What is a distribution?
365 Data Science
The Normal Distribution
365 Data Science
Central limit theorem
365 Data Science
Student's T Distribution
365 Data Science
Type I error vs Type II error
365 Data Science
Hypothesis testing. Null vs alternative
365 Data Science
The linear regression model
365 Data Science
Simple linear regression model. Geometrical representation
365 Data Science
INDEX and MATCH application of the two functions separately and combined [Advanced Excel]
365 Data Science
INDIRECT Excel Function: How it works and when to use it [Advanced Excel]
365 Data Science
VLOOKUP and MATCH another useful functions combination [Advanced Excel]
365 Data Science
VLOOKUP COLUMN and ROW - Handle large data tables with ease [Advanced Excel]
365 Data Science
The ELIF keyword [Python Fundamentals]
365 Data Science
Working with Tuples in Python
365 Data Science
Database Terminology - A Beginners Guide
365 Data Science
Relational Database Essentials
365 Data Science
Database vs Spreadsheet - Advantages and Disadvantages
365 Data Science
Conditional Statements and Loops
365 Data Science
Backpropagation – The Math Behind Optimization
365 Data Science
Monte Carlo: Forecasting Stock Prices Part I
365 Data Science
Monte Carlo: Forecasting Stock Prices Part II
365 Data Science
Monte Carlo: Forecasting Stock Prices Part III
365 Data Science
365 Data Science Online Program
365 Data Science
Data frames - Creating a data frame
365 Data Science
Data Science & Statistics: Slicing a matrix in R
365 Data Science
Data frames in R - Exporting data in R
365 Data Science
Data frames in R - Transforming data PART II
365 Data Science
Data Frames in R - Subsetting a data frame
365 Data Science
Data Science & Statistics: Matrix arithmetic in R
365 Data Science
Data Science & Statistics: Indexing an element from a matrix
365 Data Science
Data Frames in R - Extending a data frame
365 Data Science
Data Science & Statistics: Creating a matrix in R FASTER
365 Data Science
Data Science & Statistics: Creating a Matrix in R
365 Data Science
Data frames - Importing data in R
365 Data Science
Data frames in R - Getting a sense of your data
365 Data Science
Data frames in R - Transforming data PART I
365 Data Science
Data frames in R - Import a CSV in R
365 Data Science
Data Science & Statistics: Matrix operations in R
365 Data Science
Data Science & Statistics: Matrix recycling in R
365 Data Science
Tableau vs Excel: When to use Tableau and when to use Excel
365 Data Science
Download Tableau: Learn how to download Tableau Public
365 Data Science
Connecting data sources: Useful tips when connecting data sources to Tableau
365 Data Science
The Tableau interface: See how to navigate through the Tableau interface
365 Data Science
Tableau data visualization: Create your first Tableau visualization!
365 Data Science
Duplicating sheets: This is how to duplicate a sheet in Tableau
365 Data Science
Build a table in Tableau: The steps needed to create a simple table in Tableau
365 Data Science
Custom fields in Tableau: Using Tableau operators to create custom fields
365 Data Science
Custom fields in Tableau: Add calculations to tables through custom fields
365 Data Science
Totals in Tableau: Learn how to display subtotals and totals in Tableau
365 Data Science
Gross Margin calculation in Tableau
365 Data Science
What is a filter in Tableau: Set up a filter in Tableau to specify the data you want to show
365 Data Science
Joins in Tableau: Inner, outer, left, or a right join in Tableau
365 Data Science
Building a Tableau dashboard: Three types of charts you want to have in a Tableau dashboard
365 Data Science
Creating great looking charts in Tableau: Real life Exercise on charts in Tableau
365 Data Science
Joins in Tableau: Choose the correct join type
365 Data Science
How to make a data check in Tableau: A quick data check is better than no data check
365 Data Science
More on: Probability & Statistics
View skill →





🎓
Tutor Explanation

 DeepCamp AI