Time Series Talk : Moving Average Model
Key Takeaways
This video introduces the Moving Average model in Time Series Analysis, using a relatable example of a grad student bringing cupcakes to a dinner party, and explains the parameters and mechanics of the model.
Full Transcript
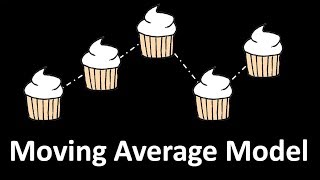
in this video we'll be talking about the moving average model in time series analysis now when I personally first learned about this model it was really confusing for me and I think that's because when they teach it they jump right into stocks and finances and those things which are not so natural to all of us so instead we'll be using a slightly different example throughout the course of this video here's the setup let's say you're a grad student at your University and every month this crazy professor so this guy right here hosts a dinner party for all the grad students and every month you're in charge of bringing cupcakes now let's say on average you always bring ten cupcakes so that's the first parameter in moving average model is this mu so if there was no other changes everything else held constant you would bring ten cupcakes every month to the party now remember this professor is crazy so part of him being crazy is that every month he's gonna say you brought the wrong number of cupcakes by some amount and that amount so being how many cupcakes he said you were wrong by you sub T is normally distributed with mean mu sub e we're gonna say that's zero and standard deviation Sigma sub D we're gonna say that's one so for example he might say you're wrong buy two cupcakes you brought two cupcakes too many or one cupcake too less or you might even say you brought just the right amount the point is he's gonna say that you brought the wrong amount normally distributed mean 0 and standard deviation 1 okay so you know this professor has a reputation for being kind of crazy so you kind of factor that into the amount of cupcakes that you're gonna bring to the party each month so the number of cupcakes are bringing each month is gonna be given by F sub t hat which is your predicted number of cupcakes I called it f for food but you can just think of it as cupcakes and that's gonna be equal to remember your mean mu which is 10 so that's gonna be your baseline that you're always gonna bring plus some coefficient C sub 1 and we're gonna say P sub 1 is 0.5 v sub 1 times the error from the previous month now let's think about let's pause for a second let's think about why this model makes sense so basically this model is telling the story of I'm always gonna bring 10 cupcakes to the party but I'm gonna adjust that by 50 percent of whatever the professor said was my error last month so it's very natural when you think about it because you're basically just taking information about how wrong you were in the previous time period to make a better estimate for the current time period okay and just hit that point home notice this is t minus 1 so that's the previous time period and here we have T so that's the current time period so to just reiterate the four parameters in this moving average model are mu your baseline number of cupcakes V sub 1 which is the multiplying factor of previous month's error mu sub e which is the mean of the error and Sigma sub E which is a standard deviation of the error so now to get an even better understanding of the moving average model let's just work through this table here so in the first month since there's no prior parties you just go ahead and bring your 10 cupcakes that's your mean now in the first month professor says hey you went over by 2 you only needed 8 cupcakes so the next month you say okay I'm gonna bring my 10 cupcakes but I'm gonna take 50% of the error from last month 50% of negative 2 would be negative 1 so you'll be bringing 9 cupcakes in the second month now that month the professor says hey you needed to bring one more you should have brought 10 so quick notation this F sub T hat is your predicted number of cupcakes u sub t is your the error the professor tells you and F sub T is how many cupcakes you should have brought that month ok so in the third month you say I'm gonna bring my 10 cupcakes plus half of what the professor said last month was my hair so 10 plus 0.5 is 10.5 let's pretend you can bring fractional number of cupcakes it just so happens that this month the professor said you were right on point so how many you should have brought is exactly how many you did bring so the next month you say I'm going to bring 10 plus the error from last month plus V times the air from last month which is 0 so that's gonna be 10 professor said you should have brought two more should have brought 12 now in the last month we have on file here you're gonna bring your 10 plus half of 2 which is 11 of course the professor being crazy says you should have brought one more you should have brought 12 okay so now let's go ahead and plot these points and by these points I mean this column which is how many cupcakes you should have brought each month the first month you should have brought eight so that's gonna down here second month we should have brought ten so that's gonna go right here third month you're gonna shoot about ten point five so that's gonna be here then we have twelve here and then we have twelve again okay so now if I just crudely connect the dots between all these points it's gonna look like here here here and then plateaus right there so that's kind of what it looks like and of course we can keep going into future months but something we can already kind of see is that this trend seems to be centered where it seems to sort of be centered at this point ten right here right and this gives us a clue as to why it's called the moving average model because we have our average of 10 but that average it's moving all about that average but it is still staying centered sort of over there right in fact if we continued you might see that it continues like this like this like this but the point is that it's always centered at ten okay so that's why it's called a moving average model now to get into a few more specifics here this is the easiest type of moving average model often called the MA which is moving average one model and you can probably guess why that's why it's called because we took one error term into account which means that in making your estimate of cupcakes for this month you are only using information about the error from last month now you can probably already guess what an MA two model would look like right an MA two model would look like your predicted number of cupcakes that you need this month is going to be mu plus b1 the error from last month and fee to some other coefficient there from two months ago okay now just to give a quick note on what the actual number of cupcakes you needed would be that would be f of T that would be mu plus V sub 1 et minus 1 plus V 2 et minus 2 plus error in the current time period ok so here is your predicted number of cupcakes in the given time period and this is how many you actually need which is basically just your prediction plus the professor's error from that current time period so this is a moving average model and along with the auto regressive model that we talked about in a different video forms kind of the foundation of a lot of the models in time series analysis and in the next video we'll talk about is how to know if some random time series that you're given might or might not be a moving average bottle okay so until next time
Original Description
A gentle intro to the Moving Average model in Time Series Analysis
Watch on YouTube ↗
(saves to browser)
Sign in to unlock AI tutor explanation · ⚡30
Playlist
Uploads from ritvikmath · ritvikmath · 47 of 60
1
 2
2
 3
3
 4
4
 5
5
 6
6
 7
7
 8
8
 9
9
 10
10
 11
11
 12
12
 13
13
 14
14
 15
15
 16
16
 17
17
 18
18
 19
19
 20
20
 21
21
 22
22
 23
23
 24
24
 25
25
 26
26
 27
27
 28
28
 29
29
 30
30
 31
31
 32
32
 33
33
 34
34
 35
35
 36
36
 37
37
 38
38
 39
39
 40
40
 41
41
 42
42
 43
43
 44
44
 45
45
 46
46
 ▶
▶
 48
48
 49
49
 50
50
 51
51
 52
52
 53
53
 54
54
 55
55
 56
56
 57
57
 58
58
 59
59
 60
60

Math Team Update
ritvikmath
Single Variable Calculus Volume of a Sphere - Proof 1
ritvikmath
Single Variable Calculus Volume of a Sphere - Proof 2
ritvikmath
Multivariable Calculus Volume of a Sphere Proof - Triple Integrals
ritvikmath
Multivariable Calculus Volume of a Sphere Proof - Double Integrals
ritvikmath
The Euclidian Algorithm
ritvikmath
Proving the Chain Rule
ritvikmath
Proving the Fundamental Theorem of Calculus Part 1
ritvikmath
Proving the Fundamental Theorem of Calculus Part 2
ritvikmath
Math Puzzle - Poison Perplexity
ritvikmath
Math Puzzle - Poison Perplexity - Solution
ritvikmath
Expected Value and Variance of Continuous Random Variables (Calculus)
ritvikmath
Expected Value and Variance of Discrete Random Variables (No Calculus)
ritvikmath
Array Method
ritvikmath
Complex Power Series and their Derivatives
ritvikmath
Distributions - Intro
ritvikmath
The Poisson Distribution
ritvikmath
The Bernoulli Distribution
ritvikmath
The Binomial Distribution
ritvikmath
The Continuous Uniform Distribution
ritvikmath
The Geometric Distribution
ritvikmath
The Triangular Distribution
ritvikmath
The Exponential Distribution
ritvikmath
The Borel Distribution + Notes on Poisson Distribution
ritvikmath
The Gamma Distribution
ritvikmath
The Normal Distribution
ritvikmath
The Laplace Distribution
ritvikmath
The Chi - Squared Distribution
ritvikmath
Overfitting
ritvikmath
Vector Norms
ritvikmath
Truths Behind the Titanic : K-Nearest Neighbor
ritvikmath
The Mathematics of Breakups
ritvikmath
Sillyfish
ritvikmath
Finding Optimal Paths - Dynamic Programming
ritvikmath
HowToDataScience : Scraping Twitter Data
ritvikmath
Decision Trees
ritvikmath
Perceptron
ritvikmath
Naive Bayes
ritvikmath
K-Nearest Neighbor
ritvikmath
Evaluating Machine Learning Models
ritvikmath
Decision Tree Pruning
ritvikmath
K-Means Clustering
ritvikmath
Gaussian Mixture Model
ritvikmath
Data Science - Fuzzy Record Matching
ritvikmath
Time Series Talk : Autocorrelation and Partial Autocorrelation
ritvikmath
Time Series Talk : Autoregressive Model
ritvikmath
Time Series Talk : Moving Average Model
ritvikmath
Time Series Talk : ARMA Model
ritvikmath
Time Series Talk : ARCH Model
ritvikmath
Time Series Talk : White Noise
ritvikmath
Time Series Talk : Stationarity
ritvikmath
Time Series Talk : ARIMA Model
ritvikmath
Time Series Talk : Lag Operator
ritvikmath
Time Series Talk : What is Seasonality ?
ritvikmath
Time Series Talk : Seasonal ARIMA Model
ritvikmath
So ... What Actually is a Matrix ? : Data Science Basics
ritvikmath
Derivative of a Matrix : Data Science Basics
ritvikmath
Basics of PCA (Principal Component Analysis) : Data Science Concepts
ritvikmath
Eigenvalues & Eigenvectors : Data Science Basics
ritvikmath
The Covariance Matrix : Data Science Basics
ritvikmath
More on: RAG Basics
View skill →








Related Reads
📰
📰
📰
📰
Your RAG Eval Isn't Flaky. Your Retrieval Is Non-Deterministic.
Dev.to · Vasyl
Reciprocal Rerank Fusion (RRF): The Simple, Powerful Way to Combine Keyword + Semantic Search in RAG
Dev.to · Christopher S. Aondona
RAG Evaluation with RAGAs: Faithfulness, Context Recall, and Answer Relevance
Dev.to · Michael Pham
Stop Serving Raw Cosine Scores: Explainable RAG Confidence Scoring at Query Time
Dev.to AI
🎓
Tutor Explanation

 DeepCamp AI