K-Means Clustering
Key Takeaways
The video introduces the K-Means Clustering method in machine learning, covering its basics, algorithm, and limitations, including handling complex cases and requirements for linear separation between clusters.
Full Transcript
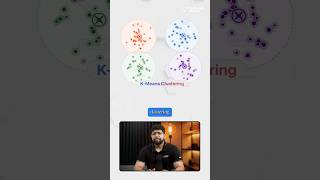
well in this video we'll be talking about a type of machine learning algorithm called k-means clustering the goal of k-means clustering is to classify some mystery point based on some information about it into one of K classes k is a number of classes you want to separate your space into for example as in many of our other machine learning videos we'll be using the example of trying to classify a fish as a salmon or a tuna based on stuff about it in this case its weight and its length so you see in the space I have several points all these red circles represent tuna and all these orange triangles represent salmon so pretend now you've got this gray X a mystery fish with this following weight and height over length and you're trying to figure out should I assign it a tuna or a salmon naturally we would say tune up because it's you know in this area that tune are in but how does k-means clustering deal with this the best way to demonstrate this algorithm is literally just to show it in action I think so as said before the first thing you have to do is decide on your K that's one of the drawbacks of this algorithm is that you need to know how many groups your space is divided two into prior to running this algorithm and sometimes you just don't know but in this case we do know that there's two groups salmon and tuna so you take the number of groups you have and you assign that many initialized needs means in this case in terms of average you wanna think of it like that so let's just say I choose one initial value right here and I choose one initial value let's say right here we're gonna see that this is a pretty bad initial approximation but we're gonna see how K means fixes this so we get the right classification so once you have these two values this mean 1 mu 1 and u 2 you can think of it that way what you do for each point in the plane is figure out is it closer to the first mean or the second me and you go ahead and assign it to that point so for example if this top one is the one that represents salmon and the bottom one represents tuna then anytime a point of all these points we see is closer to the bottom one we say it's a tuna if it's closer to the top one we say it's a sin it turns out there's a really easy way to divide the plane if we have these two points basically you just put the line that's immediately between these two guys and I'm gonna shift this up a little bit okay so this is the line which cuts off whether it's closer to the bottom point or the top point okay so for example all these points up here are closer to the top mean and all of the points down here of which there's only three or four are closer to the bottom mean so that means all the points below the line get assigned as tuna all the points above get assigned as salmon we see that all the salmon are correctly classified by the tuna are split in a pretty bad way right now so the next thing that k-means clustering does is based on all the points that are assigned to one mean or the other it takes the average of all those points so it takes the average X average Y and if we have more dimensions it takes the average of all those other dimensions and it reinitialize --is these means to those average values so let me show you graphically what that means it's a little bit easier for the bottom points because there's only three or four of them so the average value seems like it's about here where I drew that little dot so what happens is this mean shifts up and its new location is right there okay now the same thing happens with these points we see that there's more salmon so it's gonna be pulled in that direction let's just say the average value is something like there okay so this mean right here moves to its new value and the algorithm basically just reinitialize is it reclassifies all the points in our space to now see if it's closer to this mean or this mean and what that does effectively as shifts are aligned so that it is now this line I didn't explicitly say it when you shift this down because I want to make one more iteration so I didn't explicitly say it but the way I get this line is basically just saying this is the line that is equidistant between these two points so every point on this line is equidistant to both points which means that if you're on this side of line you're closer to this point if you're on this side of the line you're closer to this point and you've probably seen me fudging around these points here I promise this is just for the explanation so now that we have our two new means and our new line we reclassify whole points so that means all these guy right here are classified as tuned up all these guys up here at classified us and so we're almost there we just have a couple of mistakes right here so we reinitialize so this guy gets set to the mean of this cluster so about right there and this guy gets set as the mean of this cluster so that's gonna be further in this direction and we reinitialize so this line looks more like this now right and now we reclassify so all these get set is tuned up all these get set is Sam and visually we see that we've succeeded but the algorithm doesn't know that yet so what does it do it really breaks the means so now it's perfectly in the middle of this tunic cluster this guy's perfectly in the middle of the salmon cluster and the line is honestly not going to shift that much so how does the algorithm know when to stop basically it knows when to stop it will stop now basically because there's been no change in the assignments which means that all these that were classified as salmon before are still classified as salmon all these classified is tuna in the last iteration are still classified as students so it can go ahead and stop that is literally how canyons clustering works it just keeps shifting around these means and I've drawn a simple example with two means you could have three or four and you wouldn't have a single line anymore you would have kind of triangle or four lines if you had more clusters which divide up your plane but basically the means keep getting real initialized until there's no more change in the labels or you can set some other stopping criteria like a hundred or a thousand iterations that's basically how keen Ian's clustering works now let's talk about some of the pros and cons of k-means clustering the main Pro I would say is its simplicity and that is in terms of simplicity of understanding it we saw that it's we went through it in just a couple minutes and also its simplicity in computation think about all you have to do each iteration once you have your means you have to calculate the Euclidean distance in the plane from each of your points which isn't a very expensive operation it's just a couple subtractions squaring some numbers so and then once you have those labels you basically just classify all your points and then you would see if the classification has changed from the previous iteration and if it has then you would just reinitialize and take the mean of your new cluster so there's not that much high-level computations going on that's the main thing it has going for it of course it's going to have its limitations usually when something is really simple there's cases it just can't account for so let's look at this case specifically again we have two clusters and as human beings we see that there's a very natural grouping to them what we would do is what we want to do is basically take the circle and use that as our divider and we'd have a pretty good classification here well let's see what happens with k-means let's say that we set one mean initially here I think I lost my other mean here okay well that's fine we said the other mean to be right here okay so what happens is it sets the middle point which is say that's right there and it classifies everything above as a salmon or Orange it classifies everything below as a tuna or red for example now of course what happens is it shifts the mean so these honestly aren't going to shift much maybe this moves down a little bit maybe this kind up a little bit let's say the line for that reason stays the same because all you've done is move these guys closer to each other due to the symmetry of the problem so let's say that in the second iteration nothing gets classified differently so it thinks it succeeded but obviously it's failed miserably right it's basically gotten half of them wrong because something like that it's classified everything above as orange even though several of them are red everything below as red even though several of them are orange so when there's not a good linear separation like up here or also if the cluster sizes are very very different like if you have for example a little cluster of points over here and then you have a massive cluster of points over here that's also going to cause some problems because k-means tends to pick about the same number of points in each of the K clusters in the end which you might not necessarily want right here it just it just so happens that this cluster is smaller than this cluster so you means we'll have a problem there too and of course another problem we noticed in the beginning of the video was you need to know this K beforehand this doesn't really find the K for you there are other algorithms that will find the K but this is not one of them so you need to know how many classes you want beforehand which isn't always practical so I found that a little dot here okay so that is k-means clustering in a nutshell so we'll be looking at ways to overcome this using other models going forward and we'll see how they do better than k-means clustering and the cons they have as a result okay so until next time
Original Description
Intro to the K-Means Clustering method in machine learning
Playlist
Uploads from ritvikmath · ritvikmath · 42 of 60
1
 2
2
 3
3
 4
4
 5
5
 6
6
 7
7
 8
8
 9
9
 10
10
 11
11
 12
12
 13
13
 14
14
 15
15
 16
16
 17
17
 18
18
 19
19
 20
20
 21
21
 22
22
 23
23
 24
24
 25
25
 26
26
 27
27
 28
28
 29
29
 30
30
 31
31
 32
32
 33
33
 34
34
 35
35
 36
36
 37
37
 38
38
 39
39
 40
40
 41
41
 ▶
▶
 43
43
 44
44
 45
45
 46
46
 47
47
 48
48
 49
49
 50
50
 51
51
 52
52
 53
53
 54
54
 55
55
 56
56
 57
57
 58
58
 59
59
 60
60

Math Team Update
ritvikmath
Single Variable Calculus Volume of a Sphere - Proof 1
ritvikmath
Single Variable Calculus Volume of a Sphere - Proof 2
ritvikmath
Multivariable Calculus Volume of a Sphere Proof - Triple Integrals
ritvikmath
Multivariable Calculus Volume of a Sphere Proof - Double Integrals
ritvikmath
The Euclidian Algorithm
ritvikmath
Proving the Chain Rule
ritvikmath
Proving the Fundamental Theorem of Calculus Part 1
ritvikmath
Proving the Fundamental Theorem of Calculus Part 2
ritvikmath
Math Puzzle - Poison Perplexity
ritvikmath
Math Puzzle - Poison Perplexity - Solution
ritvikmath
Expected Value and Variance of Continuous Random Variables (Calculus)
ritvikmath
Expected Value and Variance of Discrete Random Variables (No Calculus)
ritvikmath
Array Method
ritvikmath
Complex Power Series and their Derivatives
ritvikmath
Distributions - Intro
ritvikmath
The Poisson Distribution
ritvikmath
The Bernoulli Distribution
ritvikmath
The Binomial Distribution
ritvikmath
The Continuous Uniform Distribution
ritvikmath
The Geometric Distribution
ritvikmath
The Triangular Distribution
ritvikmath
The Exponential Distribution
ritvikmath
The Borel Distribution + Notes on Poisson Distribution
ritvikmath
The Gamma Distribution
ritvikmath
The Normal Distribution
ritvikmath
The Laplace Distribution
ritvikmath
The Chi - Squared Distribution
ritvikmath
Overfitting
ritvikmath
Vector Norms
ritvikmath
Truths Behind the Titanic : K-Nearest Neighbor
ritvikmath
The Mathematics of Breakups
ritvikmath
Sillyfish
ritvikmath
Finding Optimal Paths - Dynamic Programming
ritvikmath
HowToDataScience : Scraping Twitter Data
ritvikmath
Decision Trees
ritvikmath
Perceptron
ritvikmath
Naive Bayes
ritvikmath
K-Nearest Neighbor
ritvikmath
Evaluating Machine Learning Models
ritvikmath
Decision Tree Pruning
ritvikmath
K-Means Clustering
ritvikmath
Gaussian Mixture Model
ritvikmath
Data Science - Fuzzy Record Matching
ritvikmath
Time Series Talk : Autocorrelation and Partial Autocorrelation
ritvikmath
Time Series Talk : Autoregressive Model
ritvikmath
Time Series Talk : Moving Average Model
ritvikmath
Time Series Talk : ARMA Model
ritvikmath
Time Series Talk : ARCH Model
ritvikmath
Time Series Talk : White Noise
ritvikmath
Time Series Talk : Stationarity
ritvikmath
Time Series Talk : ARIMA Model
ritvikmath
Time Series Talk : Lag Operator
ritvikmath
Time Series Talk : What is Seasonality ?
ritvikmath
Time Series Talk : Seasonal ARIMA Model
ritvikmath
So ... What Actually is a Matrix ? : Data Science Basics
ritvikmath
Derivative of a Matrix : Data Science Basics
ritvikmath
Basics of PCA (Principal Component Analysis) : Data Science Concepts
ritvikmath
Eigenvalues & Eigenvectors : Data Science Basics
ritvikmath
The Covariance Matrix : Data Science Basics
ritvikmath
More on: Unsupervised Learning
View skill →






🎓
Tutor Explanation
 DeepCamp AI