Six Sigma Full Course 2026 | Six Sigma Green Belt Training | Six Sigma Training | Simplilearn
Skills:
PM Basics80%
Key Takeaways
This video provides a comprehensive introduction to Six Sigma, covering its underlying concepts, principles, and methodologies, including the DMAIC framework, process mapping, and statistical analysis, with a focus on practical application and real-world examples, utilizing tools such as Minitab and Excel, and highlighting key concepts like lean management, quality control, and continuous improvement, with the goal of preparing viewers for Six Sigma Green Belt certification and providing a found
Full Transcript
Hey everyone, welcome to the six sigma full course by simply learn. In this course, you learn proven ways to improve processes, reduce mistakes and increase quality in any businesses. Six sigma is a strong method used worldwide to make work more efficient and get great results. This is a great time to learn because six sigma skills are in high demand and companies want people who can make operations smoother, lower cost and improve quality. We'll cover everything from the lean basics to advanced tools explaining all the ideas simply with practical lessons. So whether you're new to training or aiming for certification, we will help you step by step to become a confident six sigma expert. But before we move on, if you are interested to master advanced process optimization and become a lean six sigma expert, this program is for you. Join simply learns lean six sigma expert course to earn globally recognized green and black belt certifications accredited by IASC. You'll gain hands-on experience with 13 projects, gel simulations, and 18 hardware case studies. plus master powerful tools like mini tab and generative AI for quality management. So what is project management? Now as defined in PMI's PM, project management is application of knowledge, skills, tools and techniques to project activities to meet project requirements. So every project will have an objective to accomplish. Similarly, the objective of project management is to make the final deliverables in a finite time and budget. This involves having clear understanding about the deliverables of the project required resources for the project. Resource in terms of human resources, technical resources, financial resources etc. Project manager should have a full picture of those aspects. We can call it as constraints or aspects and manage those throughout the project life cycle for which a project manager should have a full view about a project and what is that this project has to accomplish. that objective should be clear. So as part of project management the six constraints which project manager should look at are scope, time, quality, cost, risk and resources. So each of these areas has very important role to play in project management. The clarity in scope, the clarity in terms of schedule within which the project has to be delivered. the cost what it incurs to that particular project once it is finalized one cannot vary one cannot change without any proper approvals. Similar to that we have quality management which has to ensure the scope the specifications what are defined project output will be accordingly achieved. Risk every project is taken up for a specific reason by organization. So organization should assess the risk associated with the project and similarly as project progresses various different risks has to be identified like risk related to project management, risk related to technology area, risk related to resources, risk related to financial things. So broadly risk management plays a very important role. So there will be something called contingency reserve kept for a identified risk above the cost what is estimated for various deliverables from the project. So every projects require resources. Resources may be in terms of human resources, financial resources, technology resources, environmental resources. So all these resources are used to produce the output of the project. So these resources has to be managed with the sufficient optimization and standardizations required. Now let us understand the definition of a project. So what is a project? PMI defines a project as a temporary endeavor undertaken to create a unique product, service or result. The temporary nature of a project indicates that a project has a definite beginning and end. So when I say product unique product it means every output it may be similar products you are producing with the same features and functionality but the output of every project is unique because it is unique in terms of all the six constraints what we just discussed now. Now now when I say product it is very easy for us to visualize. It may be a desktop, it may be a laptop, it may be a car, it may be a machine etc. But how do I visualize a service? Now project output is a service. Now it is it's about building a capability a project by through a project a capability can be built to ensure services can be provided that's what the output of project is service for example if I think about a taxi services for providing a taxi services I need a mobile app I need taxi I need a server I need a data center so all these are various different products and services here service example can be internet service so combination of all these services and products builds the capability for an organizations who can provide the taxes services. So building that capability we say it is an output of a particular project which is called service. Similarly results can be improvement of something improvement in customer satisfaction increase in um some specific objectives or specific results needs to be achieved in performance perspective. So output of every project will be unique product or a service or a result. This we need to clearly understand. So when we say there is a definite beginning and end every project starts at certain point in time and ends at certain point in time. So it has a definite beginning and end that is the reason it is temporary in nature. It is not an ongoing business activity. Before we begin let's have a look at an incident where two project managers John and Ted are talking to each other. Jon is a senior project manager while Ted is a part of his team. Jon finds Ted to be upset. So he asks him is there anything he can help him with to which Ted replies that his project failed. Jon further asks him what could be the possible reason for the project failure. Ted tells him that it's because he was not able to manage the time and budget. Now Jon asks him if he is PMP certified to which Ted says he isn't. Then John suggested that he must take the PMP certification which will not only give his project better performance but also help him upskill in his career. So today we will discuss about PMP certification in detail. Let's first have a look at all the topics we will cover. We will begin with what is PMP. Then we will check top 10 reasons to get PMP certified. Followed by the basics of PMP. Then after we know the PMP basic concepts, we will check who can get this certification and pattern for the PMP exam. Then we will learn about the pinog guide which is an integral part to prepare for the PMP exam. Finally, we will see the cost and the validity of the certification. So without any further ado, let's begin with what is PMP? PMP or project management professional is the world's most renowned project management certification for project managers. This certification is provided by the project management institute. Now when we know what is project management professional or PMP certification, let's have a look at some reasons why you should get PMP certified. Today I will give you top 10 reasons to take PMP certification. PMP certification helps you become a better project manager. The process that helps us acquire the certification goes to several phases like gaining project management experience and passing the PMP exam which helps you in bringing sanity to the project manager. The process helps project managers to learn different industry trends, have practical knowledge and several other project management constraints. The second reason that we have is project management certification makes a rum more valuable. As we have discussed earlier that PMP certification is the most renowned project management certification. So having it on the resume will definitely help the interviewer recognize our skills. There are companies that only accept project managers who are PMP certified. PMP certification not only helps in switching the job or finding a new one, it helps in progressing in the current company as well. The third reason that we have is it provides more job opportunities. When one acquires the PMP certification, it proves that one has expertise in completing the project effectively and efficiently. So the certification increases the trust factor of the interviewer in you and increases your probability of getting that job. The fourth reason that we have is salary hikes. PMP certified project manager is one of the highest paid jobs around the globe and this trend will continue to grow. The global survey by the project management institute shows that PMP certified project managers tend to get 20% more salary than the non-certified project managers. The next reason that we have is PMP certification validates your dedication to the job. The certification requires several months of training. It requires several hours of project management experience and exposure. This experience and exposure explains the seriousness of a project manager towards its career path. Then sixth we have is PMP certification is globally acknowledged. PMP certification is the most renowned certification all over the world. It helps project managers to be a part of different types of industries all over the globe. PMP certification is the most renowned certification all over the world. Project managers who are PMP certified may get jobs in different types of industries all over the world. PMP certification not only provides theoretical knowledge but also helps in gaining practical knowledge which further helps in increasing the confidence of a project manager. The next reason that we have is better project performance. PMP certified project managers tend to deliver better projects than the non-PMP certified project managers. This is because PMP certified project managers are well aware of five process groups, 10 knowledge areas and 49 processes which helps them have a clear picture of different aspects involved in a project. The eighth reason that we have is it increases your networking opportunities. There are several communities that one becomes a part of when they sign up as a PMI member. These communities have meetings regarding new job opportunities and this helps in having a professional network. The ninth reason that we have is job security. Job security is a major reason that a professional thinks of before opting for a particular profession. Today in the world of recession where companies are drowning, the demand for PMP certified project managers goes on increasing. The last and the 10th reason we have is expertise in practical application. When one appears for a PMP exam, they need extensive preparation. They need to have thorough knowledge of process groups and knowledge areas which help them develop several essential skills and move ahead in their career. Now as we move further we will look into the PMP basic concepts. The PMP basic concepts are the five project management steps. These project management steps start from the day we begin our project to the day we end our project. They begin from initiation to closure. The first step that we have is initiation, planning, execution, monitoring and controlling and closure. Now let's have a look at each of them in detail. The first step we have is initiation. Initiation involves defining the project scope. This is the step where we explain what our project will have for whom we are making that project. It helps us to identify our stakeholders who all will be the part of that project and determine the project feasibility. After this step of initiation when we have decided the scope of our project, the second step that comes is planning. In the planning phase, we define a flow to all the activities of a project. We define this flow keeping in mind all the constraints of a project like time, resources and risk. After we have defined the flow of these processes, it is time for us to look at the execution. In the execution phase, we evaluate the plan and the sequence of the task we have made. We finally put the plan in action and the project tends to start. After the project building has started and the process of execution has started, it is time for the monitoring and the controlling phase. In monitoring and controlling phase, the progress of the project is tracked and important steps for quality assurance are taken. In monitoring and controlling phase, the work being done is compared with the work as defined in the project plan. In this phase, the progress of the project is tracked and important steps for quality assurance are taken. Finally, we have the closure step. In this step, the deliverables are delivered to the client. The documentation of all that took place during the project life cycle is done and project is fully evaluated. Now, when we have seen reasons for getting PMP certified and we know the basic concepts of PMP, it is time for us to know who can get PMP certified. For getting PMP certified there can be two cases. The first case says you must have a secondary degree. A secondary degree means high school diploma or an associate degree or a degree that is globally equivalent to all of these. Then you need to have 7500 hours of leading and directing projects and 3500 hours of project management education. There can be two cases. First case can be you must have a secondary degree that means a high school diploma, associates degree or the global equivalent degree. Then you must have 7,500 hours of project management experience and 35 hours of education in project management. The second case can be you must have a 4-year degree along with 4500 hours of project management experience and 35 hours of education in project management. Now when we know who can get PMP certified, we will see the PMP exam pattern. The exam comprises of 200 questions out of which 175 questions are used for evaluation. One can answer these questions if they have thorough knowledge of five process groups in 10 knowledge areas. The time provided to complete the exam is four hours. The questions that are asked are of different types. The most common type being formula based, situation based and knowledge based. Now when we have discussed about the exam pattern, discussing about the pimog guide becomes very important. So the next topic that we have is pimbog guide. Pimok guide or project management body of knowledge is a book that comprises of several processes and different terminologies needed to crack the PMP exam. The whole syllabus of PMP exam is covered in the pinog guide by the project management and 10 knowledge areas. Apart from this, there are 49 processes that are divided amongst five process groups, 10 knowledge areas. Finally, let's have a look at the cost and validity of the PMP certification. When we talk about the cost of the certification, there can be two cases. The first case can be if we are not a member of project management institute, the exam fees is $555. The second case can be if we are a member of project management institute the exam fees is $45. If we talk about the validity of the certification the certificate is valid for a period of 3 years. After every 3 years the certificate needs to be renewed. To renew the certificate one needs to furnish a proof of 60 PDUs or professional development units. After so much information that thanks John for his time and promises to take the PMP certification at the shortest notice. Now let's have a look at the salary trends of a PMP certified project manager and a sample resumeum. If we consider the salary of a nonPMP certified project manager, it is approximately $91,000. While if we consider the salary of a PMP certified project manager, it is approximately $111,000 which is approximately 20% higher than the non-certified project manager salary. Now let's have a look at the ré of a PMP certified project manager. If you are somebody with PMP certification and looking for a project manager or a senior project manager role, your resume should look something like this. The summary in the beginning would include how much experience you have and anything that supports your claim of being a project manager. Like here James Brown has written he has more than 10 years of experience with generating and building projects. Then when you talk about your experience, you should put something that emphasizes on the responsibilities that you had, your area of expertise. Put something that shows your skill set for the desired post and also something that you learned from your former job role. This shows that you have command over your work and also the determination to skill and upskill yourself. Like here, James Brown has three years of experience as an assistant manager training new associates and then more than 3 years of experience as a project manager where he not only led projects but also learned new project management tools like Trello and Primava. After this, add relevant information regarding your education. Your resume must include skills that you have or you have gained in your years of experience. Like here, James Brown has divided his skills into two parts where he has written his technical skills and nontechnical skills. He has included a skill of agile and quality assurance software as well as he has his knowledge of different project management tools. Then putting a certifications play a major role. This proves that you're up to date and updated with current market trends. James Brown has his certifications in C and Java. And more importantly, he has his project management certification. project management professional. Here's Max, an assistant project manager, who looks tensed and is pacing around the room. Then Jack, a project manager who works with him, walks into the room and asks him, "Why does he seem so tensed?" To which Max replies he's facing difficulty in estimating the budget. Jack responds, "It might be because he's not planning the project properly." Jack reassures Max and begins to tell him about project planning. So without any further ado, let's begin with what is project planning. Project planning is the second step or phase of the project life cycle. Project life cycle has five different phases from initiation to closure. Today we will be learning about this phase that comes immediately after initiation in which the project plan is documented and further requirements are defined. Project planning includes the following things. The first and the foremost thing is describing the objectives or outputs we are expecting the project to yield. Second we have is the elaboration of the scope to make sure what the project is all about and what all can be expected from the project. The third step we have is forming a schedule. This schedule is important to run or perform different task of a project. Each task having its own start date and end date. This helps a project to finish in the schedule time and limit. Lastly, we have making and generating progress reports in which all that went during the tenure of the project is documented. This helps in evaluating the project and helps in the forthcoming projects. Now let's have a look at the project planning fundamentals. The first fundamental that we have is the determination of scope, cost and resources. The determination helps us in having a rough estimate about the time that is required to finish the project. It helps us in determining the number of people required and what should be their skill set. We can divide the project into smaller manageable sections and this is made possible with the help of work breakdown structure. The second fundamental refers to identifying the problem. There are several techniques by which we can collect information and discover issues. There may be several problems in a project and in that case several risks or issues are prioritized and the risk that requires immediate attention is dealt with first. Then comes identification of stakeholders. When we can identify the stakeholders, we can know who all will be affected and in what way which helps us having a better understanding of the project. Stakeholders may be anybody. They may be the part of the project team or project managers or customers. They help during the project and contribute to its success. Then the last fundamental we will discuss is defining project objectives. A project plan is made keeping in mind the requirements of the project team and expectations of the stakeholders. If the project team can meet the expectations of the stakeholders, then only we can say that the project is successful. Now when we know about project planning and its fundamentals, it's time to see why project planning is so important. Project planning reduces the cost and time of the project as every step is monitored and optimized in the best possible manner. Project planning increases employee satisfaction as every employee who is a part is engaged in the team for improved project performance. Project planning helps in the implementation of quality assurance as the output of every step is duly tested. Lastly, project planning helps in reducing project risk as planning helps to analyze, prioritize and deal with that risk. Moving on, let's have a look at the tools for project planning. The first tool that we have is a GAN chart. Today, GAN charts are one of the most popular project management tools. They help in tracking the status of the work at a particular time and their independencies on each other. Gan charts help in showing different phases and steps involved in a project. The second tool we will talk about is critical path method or CPM. Critical path method helps in scheduling the project activities so that the project runs properly. The critical path method focuses on the longest stretch of dependent tasks and determines the time needed to complete them. The next tool is project evaluation and review technique or per chart. PER provides a graphical representation of the project's timeline explaining the independencies of different tasks. This tool not only helps in making a schedule but also helps in coordinating with all the team members. The fourth tool we will check is work breakdown structure. Work breakdown structure is a very common tool that makes it possible for the team to break its work into manageable sections. Work breakdown structure is a step-to-step process that helps in completing the project efficiently. The last tool we will see is project documentation. Project documentation is an integral part of the project life cycle. Project documentation helps in understanding the mistakes done during the project and more importantly provides guidelines for the upcoming project. Now when we know about different tools for project planning, it becomes essential that we know the necessary steps of project planning. There are seven steps in project planning. Let's have a look at each of them in detail. The first step is identification of stakeholders. As we have discussed, stakeholders could be anybody. They could be a part of the team or a project manager or a customer. When we identify stakeholders, we can find out the expectations and requirements that are to be looked upon in this project. This gives us a clearer picture of the project and helps in establishing the project scope. So the next step we have is defining the project scope. This helps in determining a list of specific project goals and deliverables that are to be achieved during the course of the project. After we have defined the project scope, it is time to set project objectives and prioritize them. The initial ideas that were there before are now elaborated and final steps to complete the project are defined. In the next step, the deliverables are determined. After all, project deliverables are the only reason why the project is being created. This step involves finding out what these deliverables will be and the deadlines of the delivery. Then the step that comes into picture is creating a project schedule. The project schedule refers to the guidelines when a particular task is to be started and when it is supposed to end. This helps in monitoring the growth of the project and later helps in generating progress reports. The next step is the step of risk analysis. This step plays an extremely important role in the success of the overall project. It helps in identifying the risk, prioritizing them and taking steps to limit them. The last step in project planning is to generate progress reports. In this step, we update the stakeholders about the project growth and it is done so that all the concerned team members can have a look at the progress of the project. After all this information, Max thanks Jack for the explanation and looks forward to plan projects within the budget and of better quality. Six Sigma is a set of tools and techniques that have helped several companies around the world achieve business success. Hi guys, I'm Raal from SimplyLearn and let's get started with our introduction to Six Sigma. Now, let's understand this better with an example here. Let's talk about how things were before Six Sigma was introduced here. Jenny and James are having a conversation with each other. Jenny is James' manager and she's not happy at all. She says James is in a lot of trouble. This is because she found out that the customers weren't happy with the organization's service and the operational costs were way too high and as manager James had to make sure that this did not happen. Now let's have a look at the same scenario in present day. Here we have Jenny congratulating James. She's very impressed with his work but James says it's all thanks to six sigma methodology. So Jenny asks she wants to know more about six sigma. So to understand six sigma here's what you need to know. Firstly, we'll have to understand what is six sigma, what its advantages are, some of its methodologies, what are the different roles in a six sigma team, what is lean, what is a lean process, and what is lean six sigma. So now let's get started with understanding what exactly is six sigma. The six sigma methodology makes sure to find as well as eliminate any sort of defect or variation that could be affecting your product, service or process. Now this methodology is statistics based, is datadriven and focused on continuous improvement. Now this means that there's no end goal in the horizon. There's always another goal to reach. There are three core ideologies behind six sigma. The first one states that for any business to be successful, there's continuous efforts that are required so that it can achieve stable as well as predictable process results. The second ideology states that in any business or manufacturing process, there are certain characteristics that can be defined, measured, analyzed, and controlled. The final ideology says that along with the rest of the organization, the top level management plays a very important role to making sure that there's sustained quality. Now let's talk about the advantages of six sigma. Six sigma can help produce a road map or a path through which you can easily find and reduce any sort of organizational risk and reduce the operational costs. Another advantage is that it helps improve the efficiency of the process and making sure that it works in a timely manner. It decreases defects, improves the overall tracking and monitoring process and ensures that the products are aligned with the company's policies. It is also reported that it greatly helps improve customer as well as vendor satisfaction. It helps improve the cash flow and ensures that the products are complying with the regulations of the organization. Now let me tell you about the process of six sigma. Now six sigma projects are of basically two methodologies. The DMAIC and the DMADV. Now let's talk about DMIC in detail. That's short for define, measure, analyze, improve and control. This is one of the most commonly used methodologies in the world. This is commonly used by companies when they have to fix or improve an already existing product or process that does not meet the company's standards. Now let's have a look at the process. First phase is the define phase. In this phase, you define the problem that the customers are facing. You find out where you can improve and you clearly understand what the customers require of you. The second phase is the measure phase. Now in this phase you actually identify how well the process is doing in its current unaltered state. In the analyze phase you process the data that you get from the measure phase and determine what exactly is the cause of the delay or variation. In the improve phase, you start by making small changes to the business process and make sure that the problem you identified earlier is being taken care of. And finally, in the control phase, you control the new process so that it doesn't go wrong and use the same knowledge for future processes. Now, let's have a look at DMADV. This is short for define, measure, analyze, design, and verify. Now, this is also commonly known as DFSS or the design for six sigma. Now this is commonly used by companies around the world when they have a new product that needs to be created all the way from scratch. In the first phase which is the define phase, you define what the goal of the project is and what the customers require of you. In the measure phase, you measure as well as determine what the customer needs and how they respond to your products. In the analyze phase, you perform analysis to determine how you can improve your product or service so they can better serve your customers. In the design phase, you set up process details and make optimizations to the design to make sure your customer is satisfied. And finally, in the verify phase, you check how well the design is working out and how well it meets the customer's needs. Now, before we go on, let's talk about how six sigma was used in reference to the earlier example, the situation that James was facing. A survey conducted by the organization James was working for indicated that the customers weren't very happy with the organization. So they decided to fix that with the help of six sigma. So they decided that the DMIC methodology would be best suited to solve their problem. So let's have a look at what they did. Firstly in the define phase they used a tool called the voice of the customer. This tool represented the needs as well as requirements of the customer. This showed that the customers expected prompt delivery the correct product selection and a knowledgeable distribution team from the company. And now onto the measure phase. The company wanted to know why the customers didn't like them. So they performed some data collection. From there they found out that they took 56% longer than other companies to deliver their product. So they decided to reduce the amount of time it takes between order entry and the delivery of the product. And now in the analyze phase here they knew what the issue was but they wanted to know what exactly made their products delivery so slow. Why were the customers receiving the product so late? Then they performed some analysis. Their analysis showed the possible causes. It could have been inaccurate sales plans, issues with their safety stock, issues with their vendors delivery performance, and fallen behind on the manufacturing schedule. Further analysis also indicated that most of their sales, almost 80%, came from 30% of their products. The issue was that they didn't have enough safety stock to satisfy the customers who required that 30% of products. And now onto the improve phase. So now that they knew what was causing their problem, they wanted to solve it. They began to have monthly reviews and tried to make sure that their in- demand products stayed in demand. Another thing that they wanted to focus on was to make sure that they could order and provide the customer with the products that they wanted. And finally onto the control phase. They began to set up plans so that they could monitor the sales of that 30% of products that were selling the most. Each year they would review how well a product was selling and replace it if it had fallen out of favor. Now let me tell you what a six sigma team consists of. Let's talk about the roles in a six sigma team. First up is level seven. Now these are individuals who are at the novice level. Now these individuals don't know in great detail about what the project is but they have a basic understanding of the principles and the methodology behind the program. Now they usually support with smaller projects and with smaller issues but these individuals found the foundation for the people who decide where the program is going. And now we're at level six. Now these are individuals who have a yellow belt certification. Now they are core members of the six sigma team who have an understanding of how the basic metrics work and how they can perform some sort of improvement. Now they have their own areas of expertise and they're required to determine certain processes that need to improve. At the same time they're also in charge of smaller improvement projects. Now level five, these are people who have a green belt certification. Now, these individuals are usually part-time professionals who have a number of different duties to fulfill. They focus on smaller six sigma projects. They're usually involved with gathering data, performing some sort of experiment, and analyzing information. They also assist with black belt projects. And now we're at level four. These are individuals who have a black belt certification. They're usually team leaders of a six sigma project. They complete four to six projects a year and are experts in the principles, methodologies, and lean concepts. Thanks to their understanding of statistical experimental design, they can also understand the hidden reasons behind why a particular product failed. And now we're at level three. These are individuals who have a master black belt certification. Now these are individuals who are experts when it comes to resources, the practices and the methodologies that are employed in six sigma. Their main emphasis is to coach, train and certify black belts. They also are involved with other six sigma leaders to ensure a company's goals are met. Now level two, these individuals are called champions. So they work really closely with the executives and usually have a role like a senior or a middle executive level role. They also have a clear understanding of what exactly is the company's vision and mission. They also understand metrics so that they can set up a six sigma project that lines up with the company's goals. They're responsible for removing any sort of roadblock that could hamper the success of a project. And finally, we are at level one. These are the executors. Now these individuals represent the highest level when it comes to a six sigma team. Now they have training as well as experience through which they can set up six sigma projects that clearly line up with the company's goals. Their main emphasis is to ensure that the project is able to add value to the organization and at the end of the day is successful. Now this is when Jenny interjects. She wants to know about lean. John tells her that lean just like six sigma is another methodology. So what exactly is lean? Now lean is a methodology that has a very important ideology to make sure that there's continuous optimization of the processes and there's an elimination of waste. So what's waste? So waste is basically any part of the process that the customer doesn't want to pay for. It is a process that does not add any value to the customer. Now coming back to lean, here are some of its characteristics. Whenever decisions are being made in a lean team, the main emphasis is to understand how it exactly adds value to the customer. Every member in a lean team has a clear understanding of what exactly are the goals of the organization. It also encourages employees to push for further success even if the organization is in a good place or is already doing well. There's also an emphasis on crossf functional collaboration and communication. Lean focuses on answering the difficult question or the complex ones rather than employing short-term fixes. And with lean, you can easily prepare for issues that can come up in the future or improvise in unexpected circumstances. So let's talk about how lean and six sigma are different from one another. The lean methodology aims to reduce waste. It does so by analyzing the workflow. It also emphasizes on minimizing resource usage and improving customer value. Now let's talk about six sigma. The aim of six sigma is to provide nearperfect results. It wants to reduce costs and improve customer satisfaction. Basically both of them are moving towards the same goal to reduce the amount of waste and to create efficient processes. Now let's talk about the process of lean. Now there are five different steps. Let's start with the first one. Identifying value. You need to identify value by determining what exactly is the problem you're trying to solve for the customer. The second step is to map your value stream. You need to map the workflow of your company. You need to focus on the different actions and the people that are involved with the process. You need to be able to identify which parts of the process are able to add value and the ones that don't. The third step is to create a flow. You need to break up your work into smaller silos and visualize the workflow so that you can easily identify problems that might show up later. The next step is to establish pull. So you need to set up a system through which products are created only when there's a demand or a requirement for it. Through this you can optimize resource capacity. And finally we're at the fifth step which is continuous improvement. You need to ensure all your employees at all levels are involved in the continuous improvement of the process. So what exactly is lean six sigma? What if you could combine the best of both worlds? The combination of six sigma and lean methodology led to the creation of lean six sigma. Lean six sigma is a methodology that aims to solve problems, removes any form of waste or inefficiency and improving the working conditions of employees to make sure that they can serve the customers better. Now this is a combination of the tools, methods and principles that are employed in lean and six sigma. Let's talk about some of its advantages. It aims to provide customers with a better experience by streamlining the process with efficient power flows. It aims to drive higher results. It can reduce cost, remove waste and prevent defects. It can help the organization handle day-to-day problems. The decreased lead times help increase capacity and profitability. And finally, it helps with people development and improving the morale of the organization. So here we have Jim carrying a stack of sheets in his very messy cubicle. Suddenly, Jim realizes a few things. He's lost a really important file. But that's not all. The bad news just keeps on coming. He remembers that his messy desk and area are the talk of the entire office. And thanks to this, he doesn't even want to get any work done. A little angry and annoyed with himself, Jim sits down in resignation. That's when Jon walks in. Jon asks him what's wrong. Jim tells him that he's in a mess and doesn't know what to do. That's when John tells him about his solution, the 5S methodology. Now, let me tell you everything I'm going to teach you. We'll be talking about what is the 5s methodology, benefits of the FiS methodology, the process of FIS which consists of five other steps. So now let's have a look at what exactly is the FS methodology. The FIS methodology is a popular workplace organization methodology that was introduced in Japan and was first implemented by Toyota Motor Corporation. The primary reason it was developed was to make just in time manufacturing possible. So what is just in time? It's a form of manufacturing that aims to produce only the amount of product needed when it's needed. The fires methodology basically focuses on cleanliness and organization while at the same time focusing on maximizing efficiency and profit. So you could say that 5S provides a framework whose main focus is using visual management which is a way to visually communicate a number of things like performance standards or warnings in a way that requires little to no training to interpret. so that you can emphasize on using a mindset as well as tools to ensure there's efficiency and value being created. So what you're doing in this methodology is observing, analyzing, collaborating, searching for waste and then removing it. So what makes this methodology so special? Let's find out. First off, we have optimized organization. Thanks to 5S, every component that you need for work is kept in a way that's easily accessible and easy to use. So, no more time is wasted on looking for items, deciding how they can be used, or even returning them. Then, we have improved efficiency. The fires methodology enables companies to focus on ways to eliminate waste while enhancing the company's bottom line. This is made possible by improving the company's products and services. And by extension, this is able to lower costs. Next, we have bigger storage density. Now, since 5S is mainly focused on removing the unnecessary items from the work area, there's a lot of free space open for efficient usage. Then there's increased safety. So, now that all the unnecessary clutter and waste is removed from the work area, it's much safer for the employee to work in. And finally, we have improved workspace morale. Now since the workspace is a lot more cleaner, safer and more organized, the morale among employees is also greatly improved. Now let's have a look at the process of the fires methodology. Now the process behind the fires methodology consists of five Japanese terms and their translations each of whom start with the letter S, hence the name 5S. The steps are sort, set in order, shine, standardize and sustain. And now for the first step, sort. Sort or si in Japanese can be translated to tidiness. Now this step involves sorting through materials, keeping only the essential items needed to complete tasks. The aim here is to remove clutter and clear the workspace of things that don't belong there or aren't critical to the work you're doing. In this step, you clean the work area. By carefully analyzing the workspace, you need to remove any items that you don't require for work. From these removed items, you need to decide which ones need to be removed and which ones need to be recycled. Other items may need to be returned from where they were taken or there might be some items you're not sure about. These items need to be red tagged. Now, we've red tagged unknown items. The items whose ownership isn't clear or which cannot be identified are red tagged. By red tagging, what you're doing is attaching a visible tag on the item which includes information like where and when the item was found. The red tagged items are arranged in a particular location. It's likely that these red tagged items could stay in lost and found for a long time. Here are a few things you can do with them. After 30 days of staying in lost and found, supervisors from other departments can claim the items for themselves. If they stay undisturbed for 10 more days, they can be thrown away, sold or recycled. If these items are expected to be useful at some other point, they can be stored and lost and found with a specific plan for the time it's expected to be used. Now, let's have a look at the next step. Set an order. Set an order or Saton translate to orderliness. Here the aim is to organize the work area which means items need to be easy to find, use and return. So first off you need to create a 5S map. The 5S map is a floor plan or a diagram that can provide an overview of the work area, process or station. It also shows the location of different components you might be needing for work with travel parts and details on how they're related to one another. It can also include a description of the work that's done in that particular area. It also needs to be updated periodically. Then the plan needs to be communicated. Once storage locations are assigned, they're labeled. With this, employees will be able to easily identify what's inside these storage locations. Floor marking tapes could also be used to mark work areas, movement lathes, and storage supplies. Now, let's have a look at the next step. Shine. Shine or say so translates to cleanliness. Here, the aim is to remove the dust that accumulates under the clutter while ensuring it doesn't return. Here you need to perform routine cleaning. Every week, every area within the work area needs to be cleaned. Employees need to be responsible for the cleanliness of their workspace and the equipments they use. With this, they'll be able to quickly recognize problems that might arise. Difficult situations can be understood easily and items that are out of place can be recognized quickly. Now, let's have a look at our next step. Standardize. Standardize or secu translates to standardization. In this step, long-term changes are incorporated. what's being done and by whom is being written down. New practices are also being incorporated into the work procedure. First things are written down. Decisions once written down can be included as part of the standards related to a particular area. For example, the 5S map created and the red tagging of items can all be incorporated as standards based on changing business needs. These standards can be changed as well. Then you need to use tools for standardizing. Communication is really important in this step. Decisions made about the work practices need to be communicated with the employees. This can be done with fires checklists, job cycle charts and procedure labels and signs. And now let's have a look at our last step. Sustain. Sustain or shitsuk translates to discipline. Here the focus is on continuous improvement. The decisions that were made in the previous step need to be repeated to form a continuous cycle. In this step, you need to ensure that 5S is applied repeatedly as part of routine work. Some ways to sustain the program are management support, department tours, updated tours, progress audits, performance evaluations, and so on. And that's it. That's the 5S methodology. Jim decides to incorporate it as soon as possible. And after applying 5S, Jim's workspace is a lot more cleaner and better organized. Jim, thanks John for helping with that. Hey there learners, check out our certified lean six sigma green belt certification training course and earn a green belt certification to learn more about this course. You can click the course link in the description box below. What do you see on the screen? Well, it depends on your perception or how you see the world. If you are a pessimist, you might think the glass is half empty. If you are an optimist, you might think the glass is half full. If you are a realist, you might think the glass is full with water and air. However, the six sigma practitioner sees a glass that is bigger than it needs to be, assuming the current water level is what the customer desires. As we begin our journey to learn more about six sigma, it is important to know that applying six sigma is the way of seeing and analyzing the processes around you. We will talk more about what six sigma means and how the viewpoint impacts organizations in the screens to come. Let's begin this lesson by defining quality. Quality is defined as meeting the requirements of the customer. Well, what features do you look for when purchasing a car? What facilities do you want in your house or apartment when buying one? What do you expect from a premium chocolate candy bar? Answers to these questions will tell what quality means to you for each of these items. Here's a snapshot of the quality journey with a few key milestones. In the 1930s, the idea of statistical process control was conceived by Walter Schuard to monitor and control a process using statistical methods. This was used extensively during World War II to quickly expand industrial capabilities of the US. In the 1960s, quality circles were formulated. A quality circle is a self-improvement workers group that performs similar work, meets regularly to identify, analyze, and solve workrelated problems. In 1987, the International Organization for Standardization designed ISO 9000. This is a set of international standards on quality management and quality assurance for organizations to implement quality management systems. In 1987, the Baldridge award criteria was developed by US Congress to raise awareness of quality management systems and recognize US companies that have successfully implemented quality management systems. In 1988, the concept of benchmarking was introduced. Benchmarking is an improvement process where an organization measures its performance against the best organizations in its field, determines how such performance levels were achieved, and uses the information to improve its own performance. During the 1990s, the balance scorecard or BSC was introduced. It is a management tool that helps managers at all levels to align activities to the strategy of their organization and to monitor the multiple results obtained in their key areas. In 1996, the concept of re-engineering was introduced. Re-engineering is also known as business process re-engineering which involves restructuring an entire organization. The term six sigma has different meanings or implications depending on the context. Sigma is a Greek letter used in the statistical world to represent a measure of variability. The six sigma process is an important method of quality principles and techniques. Also, six sigma is a business strategy to change company culture with top management support. The sigma level is a measure of performance for a business process or service. So when you say six sigma there are several definitions that are all correct. Quality is defined as the degree of excellence of a product or service and conformance to customer requirements. Taking a process to six sigma level ensures the quality of product and increase in profits as the primary goal. In other words, six sigma signifies quality. In 1986, Bill Smith and Mikuel Harry at Motorola started the Six Sigma initiative to improve performance. In 1995, Jack Welch initiated Six Sigma at General Electric to improve the entire business system and became the global promoter of Six Sigma. In 1998, Allied Signal saved a half billion with the use of Six Sigma. In 2000, General Electric saved 2 billion annually with the use of six sigma. And in 2001, Motorola saved 16 billion commulatively with the use of six sigma. Six sigma is a business methodology that employs a customer ccentric fact-based approach to reduce process variation and waste. This helps us dramatically improve customer satisfaction, increase shareholder value, and strengthen employee commitment. The methodology is designed to make companies rethink the way they do business and generate improvements in processes and services. Following are the benefits of implementing six sigma in an organization. It eliminates the root cause of problems and defects in a process. Creates robust products and services. Reduces process variation and waste. Ensures customer satisfaction. Achieves process standardization. reduces rework by getting it right the first time. Addresses key business requirements. Helps gain competitive advantage and helps achieve organizational goals. Following are the three reasons why organizations are successful with six sigma. It is a proven systematic problem solving methodology that follows a tried and effective process known as deic which improves productivity and efficiency by eliminating defects. Six Sigma is customer focused. This methodology ensures businesses align their projects to customers needs. It allows organizations to produce better products and services and improves customer loyalty. Lastly, six sigma achieves long-term improvements based on datadriven statistical analysis to prioritize issues and fix root causes. The six sigma process is known as deic. Dea comprises five phases. Define, measure, analyze, improve, and control. These phases are the road map to problem solving and improving our processes. The effectiveness of six sigma method is derived from its structure. Each phase has an overarching objective and specific deliverables that need to be completed which helps us achieve the objectives. The purpose of the define phase is to document the problem, the desired outcome, goals, and deliverables. The purpose of the measure phase is to obtain baseline process performance levels and quantify the problem. The focus of the analyze phase is to identify the key root causes for process variation and defects. The purpose of the improve phase is to develop, test, and implement the solutions. The goal of the control phase is to monitor the key factors and maintain the gains. You learn the aspects of the demic process. Now we'll look at the tools used in each phase. The list of tools corresponds to the demic phase in which they are used. The use or application of these tools gives the expected deliverables in each demic phase for a green belt. Some of the tools listed are not required in every six sigma green belt project. These tools give us an insight into the problem and lead us toward the real issues in our processes. That is with more experience, you're likely to know the tools you need for your projects. In the define phase, we use cypo, voice of the customer or VOC, critical to quality CTQ, the quality function deployment or QFD, failure modes and effects analysis known as the FMEA or the FIA and the cause and effect C& matrix. In the measure phase, we use measurement system analysis or MSA, control charts, process capability and normality plots. In the analyze phase, we use simple linear regression or SLR, paro charts, fishbone diagram, balor modes and effects analysis, the familia, multivaried charts and hypothesis testing. In the improved phase, we use brainstorming, piloting, and also the failure modes effects analysis and design of experiments, DOE. In the last phase, control will use control charts, a control plan, and measurement system analysis. This lesson provides an overview of the certified six sigma green belt or CSSGV course. A process is a series of steps designed to produce a product and/or service according to the requirement of the customer. A process mainly consists of four parts. Input, process steps, output, and feedback. Input is something put into a process or expended in its operation to achieve an output or a result. For example, man, material, machine and management. Output is the final product delivered to an internal or external customer. For example, product or services. It is important to understand that if the output of a process is an input for another process, the latter process is the internal customer. Each input can be classified as controllable represented as C, non-controllable represented as NC, noise represented as N, and critical represented as X. The most important aspect of the process is the feedback. As can be inferred from the image, any change in the inputs causes change in the output. Therefore, y equals f ofx. Feedback helps in process control because it suggests changes to the inputs. Let us learn about the process of six sigma in the next screen. Let us understand how six sigma works in this screen. Six sigma is successful because of the following reasons. Six sigma is a management strategy. It creates an environment where the management supports six sigma as a business strategy and not as a standalone approach or a program to satisfy some public relations need. Six sigma mainly emphasizes the DMAC method of problem solving. Focused teams are assigned well-defined projects that directly influence the organization's bottom line with customer satisfaction and increased quality being byproducts. Six sigma also requires extensive use of statistical methods. The next screen will focus on some key terms used in six sigma. Let us look at the sigma level chart in this screen. As discussed earlier, the six sigma quality means 3.4 4 defects in 1 million opportunities or a process with a 99.99966% yield. The sigma level chart given on the screen shows the values for other sigma levels. Please take a look at the values carefully. Let us understand the benefits of six sigma in the next screen. The organizational benefits of six sigma are as follows. A six sigma process eliminates the root cause of problems and defects in a process. Sometimes the solution is creating robust products and services that mitigate the impact of a variable input or output on a customer's experience. For example, many electrical utility systems have voltage variability up to and sometimes exceeding a 10% deviation from nominal value. Thus, most electrical products are built to tolerate the variability. Drawing more amperage without damage to any components or the unit itself. Using six sigma reduces variation in a process and thereby reduces waste in a process. It ensures customer satisfaction and provides process standardization. Rework is substantially reduced because one gets it right the very first time. Further, six sigma addresses the key business requirement. Six sigma can also be used by organizations to gain advantage and become world leaders in their respective fields. Ultimately, the whole six sigma process is to satisfy customers and achieve organizational goals. In the next screen, let us understand six sigma and quality. Taking a process to six sigma level ensures that the quality of the product is maintained. The primary goal of improved quality is increased profits for the organization. In very simple terms, quality is defined as the degree of excellence of a product or a service provided to the customer. It is conformance to customer requirement. If the customer is satisfied with the product or service, then the product or service is of the required quality. Let us look at the history of quality in the next screen. In the mid 1930s, statistical process control SPC was developed by Walter Shuhart and used extensively during World War II to quickly expand the US's industrial capabilities. SPC is the application of statistical techniques to control any process. Walter Shuhart's work on the common cause of variation and special cause of variation assignable has been used proactively in all six sigma projects. The approach to quality has varied from time to time. In the 1960s there were quality circles which originated in Japan. It was started by Kauru Ishikawa. Quality circles were self-improvement groups composed of small number of employees belonging to a single department. Quality circles brought in improvements with little or no help from the top management. In 1987, ISO 9000 was introduced. ISO stands for International Organization for Standardization. ISO 9000 is a set of international standards on quality management and quality assurance to help organizations implement quality management systems. ISO 9000 is still in effect. Baldridge Award, now known as the Malcolm Baldridge National Quality Award, was developed by the US Congress in 1987 to raise awareness of quality management systems as well as recognize and award US companies that have successfully implemented quality management systems. In 1988, another quality approach was developed known as benchmarking. In this approach, an organization measures its performance against the best organizations in its field, determines how such performance levels were achieved and the information is used by the organization to improve itself. Then in the 1990s, there was the balanced scorecard approach. It is a management tool that helps managers of all levels to monitor their results in their key areas so that one metric is not optimized while another is ignored. During the year 1996 through 1997, an approach known as re-engineering was developed. This approach involved the restructuring of an entire organization and its processes. Integrating various functional tasks into crossf functional processes is one of the examples of re-engineering. In the next screen, let us find out about the quality gurus and their contribution to the field of quality. Let us focus on six sigma and the business system in this screen. Business systems are designed to implement a process or a set of processes. A business system ensures that process inputs are at the right place and at the right time so that each step of the process has the resource it needs. A business system design should be responsible for collecting and analyzing data so that continual improvement of its processes, products and services is ensured. A business system has processes, subprocesses and steps as its subsets. Human resources, manufacturing and marketing are some examples of processes in a business system. Six sigma improves a business system by continuously removing the defects in its processes and also by sustaining the changes. A defective item is any product or service that a customer would reject. A customer can be the user of the ultimate product or service or can be the next process downstream in the business system. Let us learn about six sigma projects and organizational goals in the following screen. Let us understand the structure of the six sigma team in this screen. There are totally five levels in the six sigma screen. The first level consists of the top executives of the organization. These people lead change and provide direction as they own the vision of the organization. For any improvement initiative to work, it is important that top management of the organization be actively involved in its propagation. The top executives own the six sigma initiatives. Next in the level are six sigma champions. They identify and scope projects, develop deployment and strategy, and support cultural change. They also identify and coach master black belts. Three to four master black belts work under every champion. Six sigma master black belts train and coach black belts, green belts and various functional leaders of the organization. They usually have at least three to four black belts under them. The fourth level in six sigma structure is six sigma black belts. They apply strategies to specific projects and lead and direct teams to execute projects. Finally, there are six sigma green belts. They support the black belt employees by participating in project teams. Green belts play a dual role. They work on the project and perform day-to-day jobs related to their work area. In the next screen, we will understand the drivers and metrics of organizational strategy. While financial accounting is useful to track physical assets, the balanced scorecard or BSE offers a more holistic approach to strategy implementation and performance measurement by taking into account perspectives other than the financial one. For an organization, traditional strategic activities that concentrate only on financial metrics are not sufficient to predict future performance. They are not sufficient to implement and control the strategic plan either. BSE translates the organizational strategy into actionable objectives that can be met on an everyday basis and provides a framework for performance measurement. The balanced scorecard helps clarify the organizational vision and mission to workable action items to be carried out and measured. It also provides feedback on both internal business processes and external outcomes. By doing so, it enables continuous improvement in strategic performance toward achieving organizational goals. The balanced scorecard achieves all this by integrating the organizational strategy with a limited number of key metrics from four major areas of performance. Finance, customer relations, internal processes and learning and growth. Many organizations in the world use balanced scorecard approaches and the number is increasing every day. In the next screen, we will describe the balanced scorecard framework. We will learn about developing a balanced scorecard in this screen. While applying the balanced scorecard in an organization, care must be taken to account for interactions between different perspectives or strategic business units and avoid optimizing the results of one at the expense of another. To outline the strategy, a top-down approach is followed by determining the strategic objectives, measures, targets, and initiatives for each perspective. The strategic objectives refer to the strategy to be achieved in that perspective. Three or four leading objectives are agreed upon. The progress towards strategic objectives is assessed using specific measures. These measures should be closely related to the actual performance drivers. This enables effectively evaluating progress. Highle metrics are linked to lower level operational measures. The target values for each measure are set. The initiatives required to achieve the target value are identified. As already mentioned, this exercise is carried out for all the perspectives. Finally, the scorecard is integrated into the management system. In the next screen, let us understand the change in the approach to the balance scorecard from the fourbox model of BSC to strategy maps. In earlier approaches to the balance scorecard, the perspectives were presented in a fourbox model. This kind of scorecard was more a comprehensive glance at the key performance indicators or metrics in different perspectives. However, the key performance indicators or metrics of different perspectives were viewed independent of each other which led to a silo-based approach and lack of integration. However, modern scorecards place the focus on the interreations between the objectives and metrics of different perspectives and how they support each other. A well-designed balanced scorecard recognizes the influence of one perspective on another and the effect of these interactions on organizational strategy. To achieve the objectives in one perspective, it is necessary to achieve the objectives in another perspective. In short, the four perspectives form a chain of cause and effect relationships. A map of interlin objectives from each perspective is created. These objectives represents the performance drivers which determine the effectiveness of strategy implementation. This is called a strategy map. The function of a strategy map is to outline what the organization wants to accomplish and how it plans to accomplish it. The strategy map is one-page view of how the organization can create value. For example, financial success is dependent on giving customers what they want, which in turn depends on the internal processes and learning and growth at an individual level. In the next screen, we will look at the impact of the balance scorecard on the organization. The balanced scorecard and strategy map force managers to consider cause and effect relationships which leads to better identification of key drivers and a more rounded approach to strategic planning. The BSC enables the organization to improve in the following ways. Being a one-page document, a strategy map can easily be communicated and facilitates understanding at all levels of the organization. An organization is successful in meeting its objectives only when everyone understands the strategy. The balance scorecard also forces an organization to measure what really matters and manage information better so that quality of decisionmaking is higher. Creating performance reports against a balanced scorecard allows for a structured approach to reporting progress. It also enables organizations to create reports and dashboards to communicate performance transparently and meaningfully. As expected, a balance scorecard helps an organization to better align itself and its processes to the strategic goals outlined in the BSC. The overall objectives of the BSE can be cascaded into each business unit to enable that unit to work toward the common organizational goal. All the activities of the organization such as budgeting or risk management are automatically aligned to the strategic objectives. To conclude, the balance scorecard is a simple and powerful tool that when implemented correctly equips an organization to perform better. Let us proceed to the next topic of this lesson in the following screen. In this topic, we will look at what lean is and how lean is applied to a process. Let us start with the lean concepts in the next screen. Let us look at the process issues in this screen. Lean focuses on three major issues in a process known by their Japanese names Muda, Mura and Marie. Muda refers to nonvalue adding work. Mura represents unevenness and Marie represents overburden. Together they represent the key aspects in lean. Let us look at the types of waste in the next screen. There are seven types of muda or waste as per lean principles. Let us understand these seven types of muda. Overp production. This refers to producing more than is required. For example, a customer needed 10 products and 12 were delivered. Inventory. In simple words, this refers to stock. The term inventory includes finished goods, semifinished goods, raw materials, supplies kept in waiting, and some of the work in progress. For example, test scripts waiting to be executed by the testing team, defects, repairs, rejects, any product or service deemed unusable by the customer or any effort to make it usable to the original customer or a new customer. For example, errors found in the source code of a payroll module by quality control team. Motion, a waste due to poor ergonomics of the workplace. For example, finance and account team sit on the first floor, but invoices to customers are printed on the ground floor causing unnecessary personnel movement. Overprocessing. Additional process on a product or service to remove unnecessary attribute or feature is overprocessing. For example, a customer needs a bottle and you deliver a bottle with extra plastic casing. A customer needs ABC3 bearing and your process is tuned to produce more precise AB7 bearings, taking more time for something the customer doesn't need. Waiting. When a part waits for processing or the operator waits for work, the wastage of waiting occurs. For example, improper scheduling of staff members. Transport. when the product moves unnecessarily in the process without adding value. For example, a product is finished and yet it travels 10 kilometers to the warehouse before it gets shipped to the customer. Another example, an electronic form is transferred to 12 people, some of them seeing the form more than once, that is the form is traveling over the same space multiple times. Next, we will look at lean waste. Other than the seven types of waste discussed, some lean experts talk about additional areas of waste. Underutilized skills. Skills are underutilized when the workforce has capabilities that are not being fully used toward productive efforts. People are assigned to jobs in which they do not fit. Underperforming processes. Automation of poorly performing process. Improving a process that should be eliminated if possible. For example, the product returns department or product discounts process. A symmetry in processes that should be eliminated. For example, two signatures to approve a cost reduction and six signatures to reverse a cost reduction that created higher costs in other areas. In the next screen, we will look at an exercise on identifying the waste type. We will cover each step of the lean process in the next few screens. In this screen, we will learn about the first step, identify value to implement lean to a process. It is important to find out what the customer wants. Once this is done, the process should be evaluated to identify what it needs to possess to meet customer requirements. The next screen will focus on the next step of the lean process, value stream mapping. In this screen, we will discuss the differences between push and pull processes. An organization can adopt either of these processes depending on the requirement. Contrary to a pull process, in a push process, the first step is to forecast the demand for a product or service. The production line then begins to fill this demand and produced parts are stocked in anticipation of customer demand. For example, a garments manufacturer produces 200 shirts based on expected demand and then waits for customer orders for them. Note that the demand is expected and not actual. Discounts offered to customers by big retailers are examples of the push process. If the garment company adopts a pull process instead, it would start making the shirts only after receiving a confirmed demand from customers. Note that although the pull approach seems better, it is not applicable to all situations. For example, a pharmacy uses a push process. In the next screen, we will learn about theory of constraints. Let us look at an example for the TOC methodology. In this screen, the three subprocesses in the packing process are coating or printing, filling, and sealing. The data for the three subprocesses are observed and collected as number of units produced in an hour. The data is as follows. Coating or printing is 900 units per hour. Filling is 720 units per hour and sealing is 780 units per hour. How can you implement the TOC methodology in this example? Let us build the TOC map for this example. The first step in the TOC methodology is to identify the constraint. Looking at the data, the output per hour from the filling process is 720. This is the constraint in the system. In the second step, the constraint is exploited by analyzing the performance using data. To break the constraint, a repair and maintenance personnel can be assigned to maintain the filling machine on a daily basis. In the third step, the other fixes in the repair and maintenance function are made as subordinate decisions to the one taken in step two. In this example, carry out the maintenance of the filling machine. In the fourth step, the constraint is elevated by implementing the decisions. In this example, remove the damages from the filling machine. The next step is to go back to step one and identify the next system constraint. As per the data collected after implementation of the first cycle of the TOC, ceiling can be identified as the next system constraint. Let us now analyze the data before and after TOC implementation. In this example, the number of units produced per hour before implementing the TOC encoding or printing process was 900 units. Filling process was 720 units and sealing process was 780 units. After implementing the TOC, the number of units produced per hour for the filling process increased to 840 from 720 units. Hey there learners, check out our certified lean six sigma green belt certification training course and earn a green belt certification to learn more about this course. You can click the course link in the description box below. Let us proceed to the next topic of this lesson. In this topic, we will discuss the concepts in design for six sigma or DFSS. Let us first understand DFSS in the next screen. DFSS or design for six sigma is a business process methodology that ensures that any new product or service meets customer requirements and the process for that product or service is already at six sigma level. DFSS uses tools such as quality function deployment or QFD and failure mode and effects analysis or FMEA. DFSS can help a business system to introduce an entirely new product or service for the customer. It can also be used to introduce a new category of product or service for the business system. For example, an FMCG company plans to make a new brand of hair oil, a type of product already in the market. DFSS also improves the product or service and adds to the current product or service lines. To implement DFSS, a business system has to know its customer requirements. DFSS can be used to design a new product or service, a new process for a new product or service or redesign of an existing product or service to meet customer requirements. Let us learn about processes for DFSS in the next screen. The two major processes for DFSS are IDOV and DMAV. IDOV stands for identify, design, optimize and verify. DMAV stands for define, measure, analyze, design and verify. In the ID OV process, the first step involves identifying specific customer needs based on which the new product and business process will be designed. The next step involves design which involves identifying functional requirements, developing alternate concepts, evaluating the alternatives, selecting a best fit concept, and predicting sigma capability. Tools such as FMEA are used here. The third step, optimize, uses a statistical approach to calculate tolerance with respect to the desired output. When IDOV is implemented to design a process expected to work at six sigma level, this is checked in the optimize phase. If the process does not meet expectations, the optimize phase helps in developing detailed design elements, predicting performances, and optimizing design. The last stage of IDOV is to verify that is to test and validate the design and finally to check conformance to six sigma standards. The other process DMAV has five stages. The first stage is to define the customer requirements and goals for the process product or service. Next, measure and match performance to customer requirements. The third stage involves analysis and assessment of the design for the process, product or service. The next step is to design and implement the array of latest processes required for the new process, product or service. The final stage is to verify results and maintain performance. In the next screen, we will look at the differences between IDOV and DMAB. The primary difference between IDOV and DMA DB is that while IDOV is used only to design a new product or service, DMA DB can be used to design either a new product or service or redesign an existing product or service. IDOV involves design of a new process while DMADV involves redesigning an existing process. In IDOV, no analysis or measurement of existing process is done and the whole development is new. The design step immediately follows the identification of customer requirements. In contrast, DMADV the existing product, service or process is examined thoroughly before moving to the design phase. The design stage comes only after defining requirements and analyzing the existing product, service or process. In the following screen, we will learn about tool quality function deployment or QFD which is one of the DFSS tools. QFD also called voice of customer or VOCC or house of quality is a predefined method of identifying customer requirements. It is a systematic process to understand the needs of the customer and convert them into a set of design and manufacturing requirements. QFD motivates business to focus on its customers and design products that are competitive in lesser time and at lesser cost. The primary learning from QFD includes which customer requirements are most important, what the organization strengths and weaknesses are, where an organization should focus their efforts, and where most of the work needs to be done. To learn from QFD, the organization should ask relevant questions to customers and tabulate them to bring out a set of parameters critical to the design of the product. Apart from understanding customer requirements, it is also important to know what would happen if a particular product or service fails when being used by a customer. It is necessary to understand the effects of failure on the customer to ensure preventive actions are taken and to be able to answer the customers in the event of failure. In the next screen, we will look at another DFSS tool, failure modes and effects analysis or FMEA. Failure modes and effects analysis or FMEA is a preemptive tool that helps any system to identify potential pitfalls at all levels of a business system. It helps the organization to identify and prioritize the different failure modes of its product or service and what effect the failure would have on the customer. It helps in identifying the critical areas in a system on which the organization's efforts can be focused. Note that while FMEA enables identification of critical areas, it does not offer solutions to the identified problems. We will look at the varieties of FMEA such as DFMEA and PFMEA in the next screen. PFMEA stands for process failure mode and effects analysis and DFMEA stands for design failure mode and effects analysis. PFMEA is used on a new or existing process to uncover potential failures. It is done in the quality planning phase to act as an aid during production. A process FMEA can involve fabrication, assembly, transactions or services. DFMEA is used in the design of a new product, service or process to uncover potential failures. The purpose is to find out how failure modes affect the system and to reduce the effect of failure on the system. This is done before the product is sent to manufacturing. All design deficiencies are sorted out at the end of this process. In the following screen, we will understand FMEA risk priority number. FMEA risk priority number or RPM is a measure used to quantify or assess risk associated with the design or process. Assessing risk helps identify critical failure modes. Higher the RPN, higher the priority the product or process receives. RPN is a product of three numbers. Severity of a failure, occurrence of a failure, and the detectability of a failure. All these numbers are given a value on a scale of 1 to 10. The minimum value of RPN is 1 and the maximum value is 1,000. A failure mode with a high occurrence rating means the failure mode occurs very frequently. A mode with a high severity rating means that the mode is really critical to ensure safety of operations. A mode with a high detection rating means that the current controls are not sufficient. In the next screen, we will look at the FMEA table. The FMEA table helps plan improvement initiatives by underlining why and how failure modes occur and helps organizations plan for their prevention. Typically, FMEA is applied on the output of root cause analysis and is a better tool for focus or prioritization as compared to multivoting. One important aspect of FMEA is that it does not need data. Experts in a particular area can form the FMEA table without having to look at data from any source. In functions such as human resources, the FMEA table is very useful as there might not be much data available to the problem solving team. The sample FMEA table is given on the screen. Please go through the contents for better understanding. In the following screen, we will discuss severity of risk priority number and scale criteria. Let us first discuss severity. Severity refers to the seriousness of the effect of the failure mode or how critical the failure mode is to the customer or the process. The severity of a failure mode is rated on a scale of 1 to 10 using a severity table. Different industries follow different structures for the severity table. A high severity rating indicates a mode is critical to operational safety. For example, a team working on FMEA of a radioactive plant may insert fatal as the effect with rating 10. Another example is the severity table for a sports team. The team manager wants to rate the severity of failure of the team in an upcoming game. she might rate it at nine given that the team would lose a big sponsorship should they face defeat which could in turn be hazardous to the team's future. Shown here is a generalized table of severity. The severity rating can never be changed. For example, if a mode has a rating of nine before improvement, it will continue to have a rating of 9 after improvement too. Let us look at occurrence of RPM and scale criteria. Occurrence is the probability that a specific cause will result in the particular failure mode. As with severity, occurrence is rated on a scale of 1 to 10 based on a table. Like the severity table, higher the occurrence of a failure, higher is its rating. Again, this table might vary depending on the industry and scenario. Sometimes the project team can use data here if available based on past data. The probability of occurrence of a failure can easily be rated. Shown here is a generalized table. Let us next look at detection of RPN and scale criteria. Detection is the probability that a particular failure will be detected. The table shown here is again a generalized one. The rating here is a bit different from severity or occurrence. Higher the detectability of a failure, lower is its rating. This is because if the failure can easily be detected, then everyone would know of it and therefore there would be less or no damage. For example, if detection is impossible, the failure is given a rating of 10. Please note that at the start of a six sigma project, the failure mode is given a relatively high detection rating. Let us look at an example of FMEA and RPN in the next screen. In this example, a bank wants to recognize and prioritize the risks involved in the process of withdrawing cash from an ATM. It can be observed from the table that not having a control in place for network issues has the highest RPN. This is due to the detectability for a network issue being very low. The next set of information in the table shows the action taken by the bank's management to address the failure modes. Following the implementation, the new RPN is calculated retaining the security level at 9. This is because the actions were not directed at reducing the severity but at the causes of failure. It can be seen that the new RPN is much lower and the risk for both causes has been mitigated. This lesson will cover the details of the define phase. Six sigma can be applied to everything around. It can be applied across almost 70 different sectors. However, it cannot be applied to all problems. The first step is to check if the project qualifies to be a six sigma project. The questions that need to be asked are as follows. Is there an existing process to implement the DMAC methodology of problem solving? A process needs to exist. The process should be in operation for the development of the product or service. Is there a problem in the process? Ideally, the process should not have any problem. If there is a problem in the process performance, the process needs to be improved. Is the problem measurable? The problem has to be measurable in order to assess the root cause and the impact of the problem on the process. Does the problem impact customer satisfaction? If the problem affects customer satisfaction, an action needs to be taken immediately. Else the customer may start finding alternate products or switch to competitors products. Does working on the problem impact profits of the company? It is very essential to assess the impact of the project on the profits of the company. If the project affects the profits of the company adversely, then such a project is not feasible. Is the root cause of the problem unknown? If the root cause of the problem is visible, then a six sigma project is not required. Other problem solving techniques can be used in this case. Is the solution unknown? If the solution to the problem is already known, then there is no need for any project. The company can directly implement the solution. The define phase of DMAC will be introduced in the next screen. The six sigma project process is known as a DMAC process. Define is the first phase in the six sigma project process. In the define phase, the problem is defined and the six sigma team is formed. The objectives of the defined phase are as follows. Clearly define the problem statement through customer analysis. Understand customer requirements and ensure that the six sigma project goals are aligned to these requirements. Define the objectives of the six sigma project. Plan the project in terms of time, budget, and resource requirements. Define the team structure for the project and establish roles and responsibilities. In the next screen, let us learn about benchmarking. Benchmarking is the process of comparing an organization's business processes, practices, and performance metrics with that of industry leaders. There are various types of benchmarking. Let us briefly look at each type. Process benchmarking entails comparing specific processes to a leading company or an industry standard. This is useful to obtain a simplified view of business operations and enables a focused review of major business functions. Process benchmarking includes comparisons of production processes, data collection processes, performance indicators, and productivity and efficiency reviews. Financial benchmarking is performed to assess overall competitiveness and productivity. It is done by running a detailed financial analysis and analyzing the result. Performance benchmarking involves comparison of products and services with those of competitors with the intention of evaluating the organization's competitiveness. Product benchmarking involves designing new products or services or upgrading existing products or services. This can involve reverse engineering a competitor's products to study the strengths and weaknesses and modeling the new product on these findings. Strategic benchmarking refers to studying strategies and problem solving approaches in other industries. Functional benchmarking is the focused analysis of a single function with the aim of improving it. Complex functions may need to be divided into processes before benchmarking is done. Competitive benchmarking includes standardizing organizational strategies, process, products, services and procedures against the competitors in the same industry. Collaborative benchmarking is a type of benchmarking where the standardization of various business parameters is carried out by a group of companies and the information is shared. If the subsidiary units of a company or its various branches carry out the benchmarking, it is called collaborative benchmarking. Let us take a look at best practices for benchmarking in the next screen. Best practice is a method that ensures continuous improvement leading to exceptional performance. It is also a method to sustain and develop the process continuously. Some of the best practices in benchmarking are as follows. Increase the objectives or scope of benchmarking. Set the standards and path to be followed at the initial stage. Reduce unnecessary effort and comply with the scope. Recognize the best in the industry to set a benchmark. Share the information derived from benchmarking. In the next screen, we will discuss project selection. Let us understand process, business process and business system in this screen. A process is a series of steps designed to produce a product or service to meet the requirement of a customer. A process mainly consists of three elements input, process, and output. A business process is a systematic organization of objects such as people, machinery, and materials into work activities designed to produce a required product or service. As shown on the screen, a process is a subset of a business process. A business process is in turn a part of a business system. A business system is a value added chain of various business processes such as sales or finance. For example, payroll calculation is a process in the HR business process of an IT company which is a business system. In the next screen, we will look at the process elements. Let us discuss the challenges to business process improvement. in this screen. The improvement to a business process of an organization faces challenges due to the traditional business system structure because it is generally grouped around the functional aspect. The main problem in a functionally grouped organization is the movement or flow of a product or service. A product or service has to go through various functions and their functional elements to reach the customer or end user. The other problem is management of the flow of products or services across various functional elements. This is difficult as usually there is no one in charge. These business process improvement problems can be solved using the project management approach to produce the product or service. In the next screen, we will learn about process owners and different stakeholders of a project. The representation of where the process owner and stakeholders are placed in the organizational hierarchy is on the screen. The process owner is a person at a senior level in the hierarchy. He is the one who takes responsibility for the performance and execution of a process and also has the authority and the ability to make necessary changes. On the other hand, a stakeholder is a person, group or organization which is affected or can affect an organization's actions. Businesses have many stakeholders like stockholders, customers, suppliers, company management, employees of an organization and their families, the society etc. Let us discuss the effects of process failure on various stakeholders in the next screen. While it is an absolute business necessity to keep one stakeholders satisfied at all times, failure to meet one or more process objectives may result in negative effects on them. In such situations, for the stockholders, the perceived value for the company gets reduced. Customers may seek other competitors for their deals while imposing penalties and finding recourse in legal action against the company. Suppliers may be on the losing front with delayed payments or not being paid at all. Company management may require cost cutown. Employees will receive diminishing wages. The community and society will be affected due to pollution created by the organization. In the next screen, we will understand the relationship between business and the stakeholder. In the diagram shown on the screen, each stakeholder is both a supplier as well as a customer, forming many closed loop processes that must be managed, controlled, balanced, and optimized for the business to thrive. Communication is the key in such situations and is facilitated through internal company processes. The next screen covers the importance and relevance of stakeholder analysis. Stakeholder analysis is an important task to be completed before doing a six sigma project. A business has many stakeholders and any change to a business process affects some or all of them. When a process does not meet its objectives, it results in the stakeholders being negatively affected which in turn affects the organization's performance. The six sigma team must factor in the reasons why a stakeholder may oppose the change effort. Let us proceed to the next topic of this lesson in the following screen. In this topic, we will discuss voice of the customer. Let us start with how to identify the customer in the following screen. Customers are the most important part of any business. A customer is someone who decides to purchase, pays, consumes and gets affected by a particular product or service. It is critical to identify and understand the customer requirements. The products or services can be designed according to these requirements. Consequently, the company is able to provide products or services the customers are willing to purchase. There are two types of customers, internal and external customers. In the next screen, we will learn about internal customers. An internal customer can be defined as anyone within the business system who is affected by the product or the service while it is being developed. Most often, internal customers are the employees of the company. For example, let us assume that there is a series of processes in a particular business system. In such a scenario, the second process is the internal customer for the first process. The third process is an internal customer for the second process and so on. The basic needs of an internal customer are to be provided proper tools and necessary equipment, imparted proper training, and given specific instructions to carry out their responsibilities. However, the needs are not limited to these alone. Other needs include the provision of company newsletters, projects, storyboards to display the letters, etc. Team meetings to share business news and announcements, staff meeting to share information and quality awards from suppliers. An internal customer is important. First of all, the activities of an internal customer directly affect the final or ultimate customer. Secondly, the activities of an internal customer affect the next process in the system. Finally, an internal customer also affects the quality of the product developed or service provided. When the needs of the internal customers, in most cases employees, are met, they are more likely to have higher perceptions of quality and also contribute to greater productivity. The satisfaction levels of the internal customers can be improved in various ways. These include a higher amount of internal communication through company newsletters and team meetings, recognitions for work, quality awards, etc. Constant training on how to be ahead and well equipped in a competitive environment is very essential too. In the next screen, we will learn about external customers. This screen focuses on the positive effects of a project on the customers. The most important aspect of any process improvement project is the customers. Internal customers are the ones who drive the project. Hence, the effect of the project on internal customers is a critical factor that needs to be considered. The positive impact of a project on the internal customers is as follows. The project is driven by highly motivated individuals or internal customers who are aware of the project objectives and scope. Individuals belonging to a credible project understand the project deliverables and display high levels of job satisfaction. These individuals go the extra mile to take up tasks beyond their job description. Such individuals make a highly motivated team focused on delivering their responsibilities in order to meet the customer requirements. Working together in a positive environment also improves team spirit and bonding. The positive impact of a project on the external customers is as follows. Process improvement projects analyze the problems and come up with an effective solution. Consequently, ensuring a better product. A successful process improvement project assists the organization in effectively meeting customer expectations or requirements. There is visible improvement in customer service. Good quality product and service ensures high customer satisfaction. Let us learn about different methods of customer data collection in the following screen. Once you begin to identify the customer types, you need to look forward to collecting customer data. Collecting data from customers is very essential as it helps consider the levels at which these customers affect the business. Begin by collecting feedback from both internal as well as external customers. Customer feedback helps fill the gaps and improve the various business processes in the organization. It helps define a good quality product as perceived by the customer and identify qualities that make the competitor's products or service better. It also helps identify factors which provide a competitive edge to the product or service on offer. There are various methods to collect feedback from the customers. Many of you might be involved in a similar activity at some point or the other. Popular and common methods are surveys conducted through questionnaires, focus groups, individual interviews with the customers. Customer complaints received via call centers, emails and feedback forms are also quite prevalent. Feedback received in this form are from dissatisfied customers. In the next screen, we will learn about questionnaires. Let us discuss the advantages and disadvantages of questionnaires in this screen. The advantages of a questionnaire are that it costs less. The phone response rate is high anywhere from around 70 to 90%. And it produces faster results. Also, analysis of mail questionnaires requires few trained resources. Questionnaire is a method used to gather data. However, there are a few disadvantages associated with it. There may be incomplete results and unanswered questions leading to a lack of clarity. The response rate of male surveys is about 20 to 30% only. At times, phone surveys can produce undesirable results as the interviewer can influence the person being interviewed. We will differentiate between telephone survey and web survey in the next screen. There are different methods to collect data for a survey. The methods need to be based on the requirements and needs of the organization. The popular methods of survey are the telephone survey and web survey. Both have their own drawbacks and benefits which are given on the screen. The organization needs to choose a method of collecting data according to the situation. It is recommended to go through the content for a better understanding. In the next screen, we will learn about focus groups. Let us now discuss the advantages and disadvantages of using a focus group for data collection. The interaction in a focus group generates information, provides in-depth responses, and can address more complex questions or qualitative data. It is an excellent platform to get critical to quality or CTQ definitions as well. On the other hand, the disadvantages of focus groups are that the learning only applies to those within the group and it is not possible to generalize. The information collected is more qualitative than quantitative which is another drawback. Additionally, they can also generate a lot of information from anecdotes and incidents experienced by the individuals in the group. In the next screen, we will discuss the interview technique. This screen discusses advantages and disadvantages of using the interview technique for data collection. Interviews have a capability to handle complex questions and a large amount of information. They also allow us to use visual aids in the process. It is a better method to be employed when people do not respond willingly and/or accurately by phone or email. However, there are some shortcomings as well. Interviews are timeconuming and the resources or interviewer needs to be trained and experienced to carry out the task. Let us discuss the importance and urgency of these inputs. In the next screen, the table shows the importance and urgency of different kinds of input. To understand the kind of input to be chosen, different kinds of methods for collecting data are identified. Telephone survey, web survey and interview are the data collection methods identified. To select the best methods, the criteria or the factors which are important to the organization are listed. The criteria are the factors based on which an organization is going to make decisions. The list of factors is then given weightage based on the importance of each factor in decisionm. As seen cost is the most important criterion for which the weightage is given 20. Response rate of the customer is next important factor and the list follows. Visualizing feature and compiling and analyzing data are the factors which have the lowest impact on the decision of selecting the methods for data collection. Each of the data collecting methods is rated between 1 and 10 based on its impact on the listed factors with 10 being highly favorable to the organization and one being least favorable. After rating all the methods with the factors listed, the sum or total is calculated. The calculation of the total involves multiplying each method's rating with the factor weightage and adding all the multiplied values of the column. That is for a telephone survey. The rating is multiplied with factors rating. 8 * 12 + 8 * 6 + 3 * 20 + 5 * 5 + 3 * 5 + 7 * 15 + 1 * 10 + 7 * 3 + 0 * 2 + 3 * 2 + 1 * 10 + 7 * 5 + 8 ultiplied 5 and the total of this is 471. In a similar way, calculate the total value for the remaining two methods. The total of other two methods are 744 and 522 respectively. Looking at the overall total of the methods, 744 is the highest. Hence, web survey is the best method for the organization to use for data collection. Let us look at the pros and cons of customer complaints data in the next screen. There are pros and cons in gathering information from customer complaints. Advantages include availability of specific feedback directly from the customer and ease in responding appropriately to every customer. On the contrary, feedback in this method does not provide an adequate sample size and may lead to process changes based on one or two inputs from the customer. The next screen will discuss the difference between product complaint and expedited service request. Product complaints and expedited service requests can act as inputs to the company for improving their process. These details address the needs of the customer in an indirect way. A product complaint means that the customer is not happy with the product that he has purchased from the company. An expedited service request means a service request is being rushed. If the customer requires the items immediately, then an expedited service request is raised from the customer and the organization tries to fulfill it to please the customer. Product complaint implies that a product is not meeting customer specification, hence it has to be improved. Expedited service request implies that service timeliness are not meeting customer requirements. Hence service has to be improved. Product complaint also implies that the customer needs for product are not completely identified. Whereas expedited service request implies that the customer timings need to be recalculated. Let us discuss the importance and urgency of these inputs in the next screen. The table shows the importance and urgency of different kinds of input. To select the best methods, the criteria or the factors which are important to the organization are listed. The criteria are the factors based on which organization is going to make decisions. These factors are then given weightage based on the importance of each factor in decision making. As seen cost involved and identification of customer need are the most important criteria for which the weightage given is 15 and the list follows. Time consumption and compiling and analyzing data are the factors which have the least impact on the decision of selecting the methods for data collection. Each method is rated between 1 and 10 based on its impact of the listed factors with 10 being highly favorable to the organization and one being least favorable to the organization. After rating all the methods with the factors listed, the sum or total is calculated. Calculation of the total is derived by multiplying each methods rating with the factor weightage and adding all the multiplied values. That is for product complaint the rating is multiplied with the factors rating. 8 * 15 + 4 * 15 + 3 * 2 + 1 * 10 + 1 * 10 + 1 * 10 + 1 * 8 + 1 * 10 + 4 * 2 + 1 * 8 + 1 * 10 and the total of this is 260. In the similar way, calculate the total value for expedited service request. The total of expedited service request is 817 and hence it is effective to the organization. Let us discuss the key elements of data collection tools in the next screen. Data collection tools will be selected based on the type of data to be collected. The key elements that make these tools effective are as follows. Data is collected directly from the primary source or customer. Hence, there is no scope for miscommunication or loss of information. Data is collected exclusively for the stated purpose. Hence, data is highly reliable. The data is captured is after understanding the organizational purpose. This makes the data exclusively relevant and serves the purpose of the organization. Data is collected instantaneously when there is a requirement. This ensures that the data is upto-date. Hence, the data is valid. The tools accurately define customer requirements. The customer requirements could be current needs or improvement to the product or service that they are currently using. The tools help to get enough information about customer requirement through which the process for improving or creating the product or service that the customer requires can be developed. In the next screen, we will discuss how the collected data can be reviewed. Collated data must be reviewed to eliminate vagueness, ambiguity, and any unintended bias. Neutra Worldwide buys laptops for its employees from a company that is into manufacture and sales of laptops. The company also provides servicing and repairs for their products to the customers. To understand the level of customer satisfaction in Neutra Worldwide and to improve its process, the laptop company is conducting a survey. The questionnaire which was prepared initially questionnaire before review had questions that led to ambiguity, vagueness and unintended bias. Let us look at each item on the survey. To understand the level of usage of the laptop and to know their customer better, the survey is raising a question related to the occupation of the customer. It gives the option of student or professional. But with this low amount of information, the company is neither able to gather the information nor will the given option cover the entire possible occupation in the market. Including an option of other, please specify would help the customer to choose and provide the information. if he does not belong to one of the two given groups. Hence, the same is added in the review so that the customer will not be in any ambiguity while filling the questionnaire. The question whether the sales executive was supportive with an option of yes or no is a question which leads again to ambiguity and unintended bias. The customer might be partially happy or partially not happy, but the choice does not let them inform their exact feeling. If the customer selects no as the option, then the company does not get enough information to understand where their sales executive went wrong. Hence, in the reviewed questionnaire, the customer is asked to rate the qualities of their sales executive, which will provide better data to the company in order to improve the process. Next we will discuss a technique named voice of customer. The voice of customer is a technique to organize, analyze and profile the customer's requirements. Voice of the customer is an expression for listening to the external customer. The table shows the customer requirements while purchasing an air conditioner. In all cases, the customer is purchasing for his or her domestic usage. Each customer is further categorized according to his needs and requirements. When the customer says that he needs a silent air conditioner, he needs sound sleep at night in the bedroom. This is primarily to remain fresh the next morning and to get rid of the noisy ceiling fan being used currently. In case the customer says that he needs an efficient AC, he needs a machine which provides good cooling at night in the bedroom. This is mainly because it gets extremely hot in summer. Also, he currently uses a ceiling fan which is not so effective in summers. On the other hand, when the customer wants to buy an AC which is not too costly, he has limited cash for the purchase. He wants to purchase a lowcost AC. Let us discuss the importance of translating customer requirements in the next screen. Customer requirement is the data collected from customers that gives information about what they need or want from the process. Customer requirements are often highle, vague, and non-specific. Some customers may give you a set of specific requirements to the business, but broadly customers requirements are a reflection of their experience. Customer requirements when translated into critical process requirements that are specific and measurable are called critical to quality CTQ factors. A fully developed CTQ has four major elements. Output characteristic Yt metric target and specification or tolerance limits. We will discuss the meaning of CTQ in the next screen. Let us understand what quality function deployment is in this screen. QFD is a process to ensure that the customers wants and needs are heard and translated into technical characteristics. It is also known as the voice of the customer or house of quality. QFD is a process to understand the customer's needs and translate them into a set of design and manufacturing requirements while motivating businesses to focus on their customers. It also helps companies to design and build more competitive products in less time and lesser costs. QFD helps in prioritizing customer requirements, recognizing strengths and weaknesses of an organization and recognizing areas that need to be worked on and areas that need immediate focus of efforts. QFD is carried out by asking relevant questions to the customers and tabulating them to bring out a set of parameters critical to the product design. Let us discuss phases of QFD in the next screen. Quality function deployment involves four phases. Phase one, product planning. In this phase, the QFD team translates the customer requirements into product technical requirements. Phase two, product design. In this phase, the QFD team translates the identified technical requirements into key part characteristics or systems. Phase three, process planning. In this phase, the QFD team identifies the key process operations necessary to achieve the identified key part characteristics. Phase four, production planning or process control. In this phase, the QFD team establishes process control plans, maintenance plans, and training plans to control operations. Next, we will understand the structure of QFD. Let us see what happens after completing the HOQ matrix. Completing one HOQ matrix is not the end of the QFD process. The output of the first HOQ matrix can be the first stage of the second QFD phase. As shown in the image, the translation process is continued using linked HOQ type matrices until the production planning targets are developed. Let us proceed to the next topic of this lesson in the following screen. Hey there learners, check out our certified lean six sigma green belt certification training course and earn a green belt certification. To learn more about this course, you can click the course link in the description box below. In this topic, we will discuss the basics of project management. Let us start with a discussion on problem statement. Every six sigma project targets a problem that needs to be resolved. The first step of project initiation is defining the problem statement. A problem statement needs to describe the problem in a clear and concise manner. A problem statement needs to identify and specify the observed gap in performance. It should indicate the current performance state of a process and the required performance state completely derived from customer requirements. A problem statement should be quantifiable. This means it should have specified metrics including the respective units. Please note that the problem statement cannot contain solutions or causes for the problem. In the next screen, we will discuss the is or is not template. The is or is not technique was first popularized by Keaptainner Trigo Incorporated in the 1970s. It is a powerful tool that helps define the problem and gather required information. An example of a problem statement of paper cup leaks is given on the screen. The six sigma team has to answer what is the problem, what isn't the problem, where is it, where isn't it, when is it, when isn't it a problem, to what extent is it a problem, and to what extent isn't it a problem? The information is then used to fill the question areas in the is and is not issue template. In the analysis phase, if a cause cannot describe the is and the is not data, then it's not likely the main cause. In the next screen, we will list the criteria for the project objectives. The project objectives must meet the smarts criteria. SMARTS is an acronym of the characteristics desired in project objectives. Specific, measurable, attainable, relevant, timebased, and stretch. The project deliverables should be specific. Example, hospitals maintain records of all patients. Often a few forms are rejected or missed due to errors in recording the ID numbers. In this case, setting the objective as reduce form rejection is very vague. Instead, reduce patient ID errors in recording lab results is specific and effectively targets solving the problem. The project objectives should be quantifiable. Example, setting the objective as fewer form rejections is very vague. Instead, reduce patient ID errors by 30% sets a specific goal. The project objectives should be achievable and practical. The project objectives should be relevant to the problem. The project objectives must specify a time frame within which they should be delivered. The project objectives must not be easily achievable. Example, most problems and errors can be reduced by creating awareness. Hence, the objective must stretch beyond the easily attainable state. In the next screen, we will understand project documentation. Project documentation refers to creating documents to provide details about the project. Such documents are used to gain a better understanding of the project, prevent and resolve conflict among stakeholders, and share plans and status for the project. Documentation of a project is critical throughout the project. Some of the benefits achieved through project documentation are mentioned below. Documentation serves as written proof for execution of the project. It helps teams achieve a common understanding of the requirements and the status of the project. It removes personal bias as there is a documented history of discussions and decisions made for the project. Depending on the nature of the project, each project produces a number of different documents. Some of these documents are the project charter, project plan, and its subsidiary plans. Other examples of project documentation include project status reports including key milestones report, risk items and pending action items. The frequency of these reports is determined by the need and complexity of the project. These reports are sent to all stakeholders to keep them a breast of the status of the project. Another example of project documentation is the final project report. This report is prepared at the end of the project and includes a summary of the complete project. Project storyboard inputs generated from statistical tools, outputs from spreadsheets, checklists and other miscellaneous documents are also classified as project documents. In the next screen, we will understand project charter. We will list the project charter sections in this screen. The major sections of a project charter are project name and description, business requirements, name of the project manager, project purpose or justification including ROI, stakeholder and stakeholder requirements, broad timelines, major deliverables, constraints and assumptions, and the budget summary of the charter. In the next screen, we will understand the project plan. A project plan is the final approved document which is used to manage and control the various processes within the project and ensure its seamless execution. The project manager uses the project charter as an input to create a detailed project plan. A project plan comprises various sections. Prominent among them being the project management approach, the scope statement, the work breakdown structure, the cost estimates, scheduling, defining performance baselines, marking major milestones to be achieved, and the key members and required staff personnel for the project. It also includes the various open and pending decisions related to the project and the key risks involved. Additionally, it also contains references to other subsidiary plans for managing risk, scope, schedule, etc. In the next screen, we will learn about project scope. We will look at different techniques used for interpreting the project scope. In this screen, project scope can be interpreted from the problem statement and project charter using various tools like the PTO chart and the cypo map. The principle behind the PTO chart or the 8020 principle as we know it is a vital few trivial many. The Prito chart helps the teams to trim the scope of the project by identifying the causes which have a major impact on the outcome of the project. The cypo map is a high-level process map which helps all team members in understanding the process functions in terms of addressing questions like who are the suppliers, what are the inputs they provide, what are the outputs that can be obtained and who are the customers. As discussed earlier, cypo stands for suppliers, inputs, process, outputs and customers. In the subsequent screen, we will learn about process maps. Cypo is a macrolevel map that provides an overview of the business process where a process map is a microlevel flowchart that provides an indepth detail of a process. The process map covers details at all levels and provides a walk through the current process experience. The cypo map is used as a basis while drawing a process map. A level one process map provides in-depth information. But the final process map drills further into detail. In the following screen, we will understand the project metrics. Let us discuss consequential metrics in this screen. Consequential metrics measure any negative consequences. These can be business metrics, process metrics or both. They measure the negative effects of improving the primary or key metrics. They are used to measure the indemnity triggered by any damage in the project. The inconsistent use of consequential metrics can lead to loss of opportunity and rework after a project ends. Consequential metrics help to understand the cause and effect relationship between the primary and the secondary metrics and the impact it has on the organization. Let us take a look at an example for consequential metrics in the next screen. We will discuss the best practices in this screen. The following are some of the best practices of consequential metrics. Setting consequential metrics during the measure phase and monitoring these metrics after finalizing the project will help to analyze whether the link between previous primary and secondary metrics has been established. Also linking consequential metrics with primary metrics and finally linking them with secondary metrics provides clarity on the impact of these metrics. Assessing and evaluating the cause and effect relationship between these metrics is helpful to the organization as a whole. In the next screen, we will list some project planning tools. The project manager uses various tools to plan and control a project. One of the tools which he uses is the burrito chart. Other prominent tools include the network diagram, the critical path method also called CPM, the program evaluation and review technique which is also known as per Gant charts and the work breakdown structure also known as WBS. In the next screen we will discuss parto chart. Curto chart is a histogram ordered by the frequency of occurrence of events. It is also known as the 8020 rule or vital few trivial many. It helps project teams to focus on the issues which cause the highest number of defects or complaints. To explain further the given chart plots all the causes for defects in a product or service. The values are represented in descending order by bars and the cumulative total is represented by the line. Prito chart emphasizes that 80% of the effects come from 20% of the causes. Thus, a parto chart narrows the scope of the project or problem solving by identifying the major causes affecting quality. Pareto charts are useful only when required data is available. If data is not available then other tools such as brainstorming and multivoting should be used to find the root cause of any problem. In the following screen we will continue to discuss bare chart with an example. A hotel receives plenty of complaints from its customers and the hotel manager wishes to identify the key areas of complaints. Complaints were received in the following areas. Cleaning, check-in, pool timings, miniar, room service, and miscellaneous. Cleaning and check-in can be noted as areas of concern with 35 and 19 complaints respectively. Percentage is calculated for each cause of complaint and the cumulative is derived. Pareto chart is plotted using this data. In the next screen, we will discuss network diagrams. Network diagrams are one of the tools used by the project manager for project planning. They are also sometimes referred to as arrow diagrams because they use arrows to connect activities and represent precedents and interdependencies between activities of a project. There are some assumptions that need to be made while forming the network diagram. The first assumption is that before a new activity begins, all pending activities have been completed. The second assumption is that all arrows indicate logical precedence. This means that the direction of the arrow represents the sequence that activities need to follow. The last assumption is that a network diagram must start from a single event and end with a single event. There cannot be multiple start and end points to the network diagram. In the next screen, let us discuss some terms related to network diagram. For the network diagram to calculate the total duration of the project, the project manager needs to define four dates for each task. The first two dates relate to the date by when the task can be started. The first date is early start. This is the earliest date by when the task can start. The second date is late start. This is the last date by when the task should start. The second two dates relate to the dates when the task should be complete. Early finish is the earliest date by when the task can be completed. Late finish is the last date by when the task should be completed. The duration of the task is calculated as the difference between the early start and early finish of the task. The difference between the early start and late start of the task is called the slack time available for the task. Slack can also be calculated as the difference between the early finish and late finish dates of the task. Slack time or float time for a task is the amount of time the task can be delayed before it causes a delay in the overall project timeline. In the next screen, we will discuss critical path method. Critical path method also known as CPM is an important tool used by project managers to monitor the progress of the project and to ensure that the project is on schedule. The critical path for a project is the longest sequence of tasks on the network diagram. The critical path in the given network diagram is highlighted in orange. Critical path is characterized by zero slack for all tasks on the sequence. This means that the smallest delay in any of the tasks on the critical path will cause a delay in the overall timeline of the project. This makes it very important for the project manager to closely monitor the tasks on the critical path and ensure that the tasks go smoothly. If needed, the project manager can divert resources from other tasks that are not on the critical path to tasks on the critical path to ensure that the project is not delayed. When a project manager removes resources from such tasks, he needs to ensure that the task does not become a critical path task because of the reduced number of resources. During the execution of the project, the critical path can easily shift because of multiple factors and hence needs to be constantly monitored by the project manager. A complex project can also have multiple critical paths. In the next screen, we will discuss project evaluation and review technique. We will understand the concept of risk in this screen. Risk is an uncertain event or consequence probable of occurring during a project. The main objectives of any project are time, cost, quality, and scope. Risk affects at least one of the four project objectives. It is important to understand that risk can be both positive as well as negative. A positive risk enhances the success of the project whereas a negative risk is a threat to a project's success. Some of the terms used in risk analysis and management are risk probability, issue and risk consequences. The likelihood that a risk will occur is called risk probability. To assess any risk is to assess the probability and impact of the risk. Issue is the occurrence of a risk. Risk consequences are the effects on project objectives if there is an occurrence of a risk or issue. In the subsequent screen, we will understand the process of risk analysis and management. We will list and understand some of the elements of risk analysis in this screen. Qualitative method. Qualitative methods like interview, checklists and brainstorming are used to identify potential risks. Quantitative method. Quantitative methods are databased and a computer is required to calculate and analyze. These methods are used to evaluate the cost, time and probabilistic combination of individual uncertainties. Feasibility. Feasibility is the study of the project risk. This is usually carried out in the beginning of the project when the project is most flexible and risks can be reduced at a relatively low cost. It helps in deciding different implementing options for the projects. Potential impact. Once the potential risks are identified, the impact of these on the project is determined. Using this data, possible solutions for the risks are identified. RPN. RPN of a failure is the product of its probability of occurrence, severity, and detectability. A failure is prioritized based on its RPN value. A high RPN indicates high risk. RPN assists to prioritize risks. Avoiding risk. When potential risks are identified, their impact in terms of cost, time, resources, and objective perspective is calculated. If the impact is huge, then avoiding the risk is the best option. Mitigating risk. Mitigating is the second option when dealing with risks. The loss that arises from mitigating a risk is much less than the loss that arises from the temporary avoiding of risk. Accepting the risk. If a risk cannot be avoided or mitigated, then it has to be accepted. The risk will be accepted if it doesn't greatly impact the cost, time and product objective. In the following screen, we will discuss benefits of risk analysis. Benefits of risk analysis are as follows. Once the risk has been identified, it can be either mitigated, transferred or accepted. When risk is identified in a task, slack time is provided as a buffer. Identifying risks also helps in setting up an actual timeline for a project. Slack time for an activity in a project could be the result of a risk identified proactively. Identifying risks helps in setting realistic expectations from the project by communicating the risk probability and consequence to stakeholders. Risk analysis also helps to identify and plan contingency activities if the risk becomes an issue. The project team is then wellprepared to work on the issue thereby reducing the impact of the risk. In the following screen, we will take a look at the risk assessment matrix. The potential risks of a project are assessed using the risk assessment matrix. It covers potential risk areas like project scope, team, personnel, material, facility and equipment and communication. Each of these areas is assessed in terms of risk of loss of money, productivity, resources and customer confidence. In the subsequent screen, we will discuss project closure. By definition, a project has a beginning and an end. But without a formal closure process, project teams can fail to recognize the end and then the project can drag on, sometimes at great expense. Every project requires closure. For large or complex projects, it's a good idea to close each major project phase, for example, design, code, and test individually. Project closure ensures that outcomes match the stated goals of the project. Customers and stakeholders are happy with the results. Critical knowledge is captured. The team feels a sense of completion and project resources are released for new projects. In the next screen, we will list the goals of a project closure report. The project closure report is created to accomplish the following goals. Review and validate the success of the project. Confirm outstanding issues, limitations, and recommendations. Outline tasks and activities accomplished to complete the activity. Highlight the best practices for future projects. Provide the project report or summary. Provide a project background overview. Summarize the planned activities of a project. Evaluate project performance. Provide a synopsis of the process. Generate discussions and recommendations. Generate project closure recommendations. In the following screen, we will list and understand project closure activities. During project closure, the project manager needs to take care of the following activities. Finalize the project documents. Much of a project's documentation is created during the life of the project. Document collection and update procedures are well established during the project lifeline. Capture the project knowledge. Project documents are helpful for future projects in troubleshooting the product or in a future audit. Set up a project library. Ideally, the project library is set up at the beginning of the project and team members add documents as they produce them. Document the project learnings. Project learnings can be captured through team meetings, meetings with stakeholders and sponsor and through feedbacks from consultants and vendors. Provide knowledge transfer. The project manager needs to provide a summary of the project results to team members. either as a presentation at a meeting or as a formal document. Consultants should not be relieved from their position until they have transferred all the important product maintenance knowledge to the team. Get a final sign off. Schedule a meeting with the project sponsor and key stakeholders to get their final sign off on the project. Close the project office. If the project team used a project management office or a dedicated work area, arrangements need to be made to return that space for general use. Recognize and reward. The project manager has the best understanding of which of the team members have worked the best, have transformed themselves with new skills, and who might be ready for a new level of responsibility. The project manager needs to report to the team superiors what each team member has brought to the project. Celebrate. After completion of every project, the team needs and deserves a celebration. A team dinner, a team outing, gift certificates or other rewards are minor costs that generate a large return in terms of morale and job satisfaction. Make a public announcement. An announcement to the organization is a good way to highlight the success of the project and its benefits to the company. Conclude formal project closure ensures that the team has met its objectives, satisfied the customer, captured important knowledge and been rewarded for their efforts. Let us proceed to the next topic of this lesson in the following screen. Hey there learners, check out our certified lean six sigma green belt certification training course and earn a green belt certification to learn more about this course. You can click the course link in the description box below. In this topic we will discuss management and planning tools. Let us start with the discussion on affinity diagram in the next screen. The affinity diagram method is employed by an individual or team to solve unfamiliar problems. It is an effective medium where the consensus of the group is necessary. The given affinity diagram is based on an organization where the employees are not satisfied. To begin with, each member writes down ideas and opinions on sticky notes. Each note can have a single idea. The points which have surfaced during the brainstorming session are that the workers are unkind, pay is low and it is difficult to survive on the pay structure, working hours are too long, etc. In the next step, all the sticky notes are pasted on a table or wall. The sticky papers are arranged according to categories or thought patterns. Members happen to arrange their ideas based on affinity. In case a particular idea is good to go into more than one category, it is duplicated and added to several categories. After the arrangement is done, each category is named with a header card. The header card captures the central idea of all the cards in that category and draws a boundary around them. Poor compensation combines ideas like low pay, long working hours, and complaints about wages. Poor work environment encompasses issues like poor lighting, uncomfortable rooms and stuffy air. Similarly, poor relationships prevail in the workspace as the workers are unkind and there is mutual dislike. Lack of motivation is due to repetitive work and no workrelated challenges. You can see in the diagram on that slide that once all the ideas are grouped to the respective header cards, a diagram is drawn and borders are placed around the group of ideas. Thus, affinity diagram helps in grouping ideas with the common theme. In the next screen, we will discuss the interreationship diagram. During problem solving, the interreationship diagram technique helps in identifying the relationship between problems and ideas in complex situations. If the problem is really complex, it may not be easy to determine the exact relationship between ideas. The given inter relationship diagram is the result of a team brainstorming session which identified 10 major issues involved in developing an organization's quality plan. Initially the problem is defined and all the members put down their ideas on sticky notes. Each note contains only one idea. All the sticky notes are put on a table for a random display. In the next step, the causes or areas of concern are identified and a cause effect arrangement of cards is constructed by drawing an arrow between the causes and effects of the cause. This is done until all the ideas on the sticky notes are accounted for and made a part of the inter relationship diagram. Take a large sheet of paper and replicate the cause effect arrangement on it as depicted in the image. A large number of outgoing arrows indicate the root cause. Whereas a higher number of incoming arrows indicates an outcome. There are as many as six arrows originating from lack of quality strategy. This leads us to understand that it is a root cause. On the other hand, there are three arrows ending with the idea lack of TQM commitment by managers making it an outcome. In the next screen, we will understand the tree diagram. The tree diagram is a systematic approach to outline all the details needed to complete a given objective. In other words, it is a method used to identify the tasks and methods needed to solve a problem and reach a predefined goal. It is mostly used while developing actions to execute a solution while analyzing processes in detail during the evaluation of implementation issues for several potential solutions and also as a communication tool to explain the details of a process to others. The given tree diagram shows the plan of a coffee shop trying to set standards for the coffee it delivers. First, the objective is noted on a note card and placed on the far left side of the board. The basic goal of the coffee shop is to provide a delightful cappuccino experience. In the next step, the coffee shop needs to determine the means required to achieve the goal and furnish three different solutions. In other words, the answers to the how or why questions of the objectives. In this case, the cappuccino needs to be at a comfortable temperature and it should have strong and pleasing coffee aroma with the right amount of sweetness. In the next step, the three issues mentioned in the second stage are addressed at length. Each issue is answered by maintaining the espresso and steamed milk temperature. The cappuccino can be served at a palatable temperature. Strong flavored cappuccino can be prepared using a good amount of finely ground coffee beans and a good quality sweetener used in the right amount makes a great cappuccino. Thus, the tree diagram can be used to achieve a goal or define a process. In the following screen, we will discuss prioritization matrices. Let us learn about matrix diagram. In this screen, matrix diagrams show the relationship between objectives and methods, results and causes, tasks and people etc. Their objective is to provide information about the relationship. They provide importance of task and method elements of the subject. They also help determine the strength of relationships between a grid of rows and columns. They help in organizing a large amount of interprocess related activities. Let us discuss various types of matrices. In the next screen, let us learn about a process decision program chart. in this screen. Process decision program chart or the PDPC method is used to chart the course of events from the beginning of a process till the goal while emphasizing the ability to identify the failure of important issues on activity plans. The PDPC helps create appropriate contingency plans to limit the number of risks involved. The PDPC is used before implementing a plan, especially when the plan is large and complex, if the plan must be completed on schedule, or if the price of failure is quite high. The given process decision program chart shows the process which can help in securing a contract. The process starts when the seller receives an order request from a potential buyer. This can lead to fixing an appointment with the buyer, confirming the appointment date and meeting the buyer. If a date is not fixed, then buyer should be contacted till the meeting is confirmed. Without a meeting, there is a risk of losing the order. Considering an optimistic scenario where a meeting is fixed with the buyer, the seller describes the price of the product or service. If the price is competitive, the order is secured. If the price is not competitive, the seller may have to repeat the bid until the buyer agrees and the order is secure. However, the buyer may not agree to a revised bid either, in which case the seller might lose the bid. In such a scenario, the seller can justify the pricing and pursue the buyer to agree to the bid. It might work and the seller might secure the order. In the next screen, we will discuss the activity network diagram. An activity network diagram is used to show the time required for solving a problem and to identify items that can be done in parallel. It is used in scheduling and monitoring tasks within a complex project or process with interrelated tasks and resources. Moreover, it is also used when you know the steps of the project or process, their sequence and the time taken by each of the steps involved. The original Japanese name for this tool is aerrow diagram. The given activity network diagram shows a house construction plan and identifies the factors involved separately like the amount of time for each operation in one situation, the relationship of work without time for each operation and an operation by itself. The number of days is denoted by D. So the time taken for an activity like foundation to scaffolding takes around 5 days plus 4 days which is 9 days in total. The line joining electrical work and interior walls is dotted. This shows relation between them but without any timeline. Basically it means that electrical work has to be done before interior walls but the time is either not important or not available. Let us proceed to the next topic of this lesson in the following screen. In this topic, we will introduce business results for projects. Let us start with the discussion on defect per unit. We will learn about throughput yield in this screen. Throughput yield or TPY is the number of acceptable pieces at the end of a process divided by the number of starting pieces excluding scrap and rework. Throughput yield is used to measure a single process only. If the DPU is known, TPY can be easily calculated as E to the power of the negative of DPU. Here e is the mathematical constant and has a value of 2.7183. The expression can also be stated as dpu equals the negative of natural logarithm e of tpy. In the next screen we will discuss rolled throughput yield. Rolled throughput yield or rty is the probability of the entire process producing zero defects. RTY is the true measure of process efficiency and is considered across multiple processes. It is important as a metric when a process has excessive rework. TDPU is total defects per unit and is defined for a set of processes. When the total defects per unit is known, rolled throughput yield is calculated using the expression e to the power of negative of tdpu. The expression can also be written as tdpu is equal to negative of natural logarithm of rty. When the defectives are known, ro throughput yield can be calculated as the product of each process's first pass yield or fpy. First pass yield is the number of products which pass without any rework over the total number of units. First pass yield is calculated as total number of quality products over total number of units. Total number of quality products is total number of units minus total number of defective units. In the following screen we will understand FPY and RTY with an example. We will discuss process capability in this screen. Process capability or CP is defined as the inherent variability of a characteristic of a process or a product. In other words, it might also mean how well a process meets customer requirement. CP is an indicator of capability of a process and is expressed as difference of USL and LSL divided by product of six sigma. USL stands for upper specification limit. LSL is lower specification limit and sigma is the standard deviation of a process. The difference between USL and LSL is also called the specification width or tolerance. In the following screen, we will discuss process capability indices. Process capability indices or CPK was developed to objectively measure the degree to which a process meets or does not meet customer requirements. It was developed to account for the position of mean with respect to USL and LSL. To calculate CPK, the first step is to determine if the process mean is closer to the LSL or the USL. If the process mean is closer to LSL, CPKL is determined. CPKL is mean minus LSL divided by product of three and sigma. If the process mean is closer to USL, CPKU is calculated. CPKU is USL minus mean divided by product of three and sigma. Here mean is the process average and sigma represents the standard deviation. If the process mean is equidistant, either of the specification limit can be chosen. CPK takes up the value of CPKU and CPKL depending on whichever is the lower value. In the next screen, we will understand process capability indices with an example. In this screen, we will discuss CPK and CP interpretations. A CP value of less than one indicates the process is not capable even if CP is greater than one. To ascertain if the process really is not capable, check the CPK value. A CPK value of less than one indicates that the process is definitely not capable, but might be if CP is greater than one and the process mean is at or near the midpoint of the tolerance range. The CPK value will always be less than CP, especially as long as the process mean is not at the center of the process tolerance range. Non-entering can happen when the process has not understood the customer expectations clearly or the process is complete as soon as the output reaches a specific limit. For example, a shirt size of 40 has a target chest diameter of 40 in. But the process consistently delivers shirts with a mean of 41 in as the chest diameter. A machine stops removing material as soon as the measured dimension is within specified limit. Let us proceed to the next topic of this lesson in the following screen. In this topic, we will discuss team dynamics and performance. Let us start with a discussion on team stages. There are five typical stages in the team building process. Each team passes through these stages as they start and proceed through the project. The five stages in the team building process are as follows. Forming, storming, norming, performing and adjouring. In the next screen, we will discuss the first stage forming. The first stage in the team building process is called the forming stage. In this stage, the team comes together and begins to formulate roles and responsibilities. The team leader is identified and he or she starts directing the team and assigning responsibilities to other team members. Most team members at this stage are generally enthusiastic and motivated by desire to be accepted within the team. The leader employs a directive style of management which includes delegating responsibility within the team providing a structure to the team and determining processes needed for the smooth functioning of the team. Toward the end of this phase, the team should achieve a commitment to the project and an acceptance of a common purpose. In the next screen, we will discuss the second stage storming. The second phase in the team building process is called the storming stage. As suggested by the name itself, in this stage, conflicts start to arise within the team. Team members often struggle over responsibilities and control within the project. It is the responsibility of the team leader to coach and consiliate the team. The leader employs a coaching style of management which is reflected through facilitating change, managing conflict and mediating understanding between different parties. Towards the end of this phase, team members need to learn to voice disagreement openly and constructively while staying focused on common objectives and areas of agreement. In the next screen, we will discuss the third stage, norming. The third stage in the team building process is called the norming stage. In this stage, people get along and the team develops a unified commitment toward the project goal. The team leader promotes the team and participates in the team activities. Team members look to the leader to clarify their understanding as some leadership roles begin to shift within the lower rungs of the group. The leader employs a participatory style of management through facilitating change, working to build consensus and overseeing quality control. Toward the end of this phase, team members need to accept individual responsibilities and work out agreements about team procedures. In the next screen, we will discuss the fourth stage, performing. The next stage in the team building process is called the performing stage. This is the most productive stage for the project team. In this stage, team members manage complex tasks and work toward the common goals of the project. The leader employs a supervisory style of management by overseeing progress, rewarding achievement, and supervising process. The team leader leads the project on more or less an automated mode. When the project has completed successfully or when the end is in sight, the team moves into the final stage. In the next screen, we will discuss the fifth stage, adjourning. The last stage of team building is called the adjouring stage. In this stage, the project is winding down and the goals are within reach. The team members are dealing with their impending separation from the team. The team leader provides feedback to the team. The leader employs a supportive style of management by giving feedback, celebrating accomplishments, and providing closure. The team leader needs to adopt a different style of leadership at every stage. It is therefore important for a leader to understand these stages and identify the current stage that a team is in. The success of the team depends on how well the leader can guide them through these phases. In the next screen, we will learn about negative dynamics. Team members can exhibit negative behavior in more than one way during the project life cycle. This behavior has a negative effect on the dynamics of the team. The first kind of negative participants fall in the category of overbearing participants. These participants use their influence or expertise to take on a position of authority, discounting contributions from other team members. To cope with such participants, team leaders must establish ground rules for participation and reinforce that the group has the right to explore any area pertinent to team goals and objectives. Another kind of negative participant is often referred to as the dominant participant. These participants take up an excessive amount of group time by talking too much, focusing on trivial concerns, and otherwise preventing participation by others. Team leaders need to be able to control dominant participants without inhibiting their energy or enthusiasm. Some other participants are reluctant participants who feel intimidated and are not happy with the team process. Owing to their reluctance, they miss opportunities to bring up data that is valuable to the project. This can often lead to hostility within the team. One way to deal with reluctant participants is to respond positively and with encouragement to any contribution from the team member. Teamwork is more than a natural consequence of working together. Team management is more than building a relationship with individual team members. All teams face group challenges that need groupbased diagnosis and problem solving to ensure that negative participants are able to contribute and perform as part of the team. In the next screen, we will learn about group challenges. Six sigma team and their responsibilities are described here. Various roles assist the smooth execution of a six sigma project. These roles are required to support the project by providing the information and resources that are needed to execute the project. The first important member of the six sigma team is the executive sponsor. Sponsors are the source or conduit for project resources and they are usually the recipients of the benefits the project will produce. The sponsor is responsible for setting the direction and priorities for the organization. The sponsor may be a functional manager or an external customer. The next important role is that of the process owners. They work with the black belts to improve their respective processes. They provide functional expertise about the process to the project. Usually this role is played by the functional managers in charge of specific processes. The next role in the project is that of the champions. They are typically upper level managers who control and allocate resources to promote process improvements. They ensure the organization is providing necessary resources to the project and the project is fitting into the strategic plans of the organization. The first role related to the execution of the project is the role of the master black belt. This role acts as a consultant to team leaders and offers expertise in the use of six sigma tools and methodologies. Master black belts are experts in six sigma statistical tools and are qualified to teach high-level six sigma methodologies and applications. Each master black belt will have multiple black belts under him. Black belts are the leaders of individual six sigma projects. They lead project teams and conduct the detailed analysis required in six sigma methodologies. Black belts act as instructors and mentors for green belts and educate them in six sigma tools and methods. They also protect the interests of the project by coordinating with functional managers. Green belts are trained in six sigma but typically lead project teams working in their own areas of expertise. They are focused on the basic six sigma tools for acceleration of projects. Green belts work on projects on a part-time basis, dividing time between project and functional responsibilities. An executive is the person who manages and leads the team to ensure smooth working of tasks and has the power to execute decisions. A coach takes on a number of roles. He or she is the person who trains, mentors, teaches and guides the team when required. Coach also motivates and builds confidence of the members. A facilitator is a guide for the team or group also known as a discussion leader. Facilitators help the group or team to understand their common objective and plan their activities. A sponsor is a person who supports the event or the project by providing all the required resources. A team member is an individual who belongs to a particular project team. A team member contributes to the performance of the team and actively participates for fulfillment of the project objectives. The progress, achievements and the details of the project have to be effectively communicated to the team, management, customers and stakeholders. We will learn about modes of communication in the next screen. Let us understand communication within the team in this screen. The purpose of communication within the team and the modes of communication used are as follows. Meetings and emails are suitable to communicate the roles and responsibilities of the team members. Meetings, memos and emails are used by the team to understand the project status. Workshops and meetings are conducted to identify the outstanding tasks, risks, and their corrective actions. Team meetings assist decision-making. Meetings and emails ensure coordination and efficient work. The next screen will focus on communication with stakeholders. The purpose of communication with stakeholders and the modes of communication used are as follows. Meeting emails and events are suitable to convey project objectives and goals to stakeholders. Meetings, emails, and newsletters assist stakeholders in understanding project status. Workshops, meetings, and events help stakeholders to identify the adverse effects of a situation. Meetings with stakeholders assist decision-making process. In the next screen we will discuss the communication technique. Communication techniques can be grouped in various ways. The first grouping of communication techniques is based on the direction in which communication flows. Vertical communication consists of two subtypes namely downward flow of communication and upward flow of communication. In the downward flow of communication, the managers must pass information and give orders and directives to the lower levels in the organization. On the contrary, upward communication consists of information relayed from the bottom or grassroot levels to the higher levels of the company. Horizontal communication refers to the sharing of information across the same levels of the organization. This can be in the form of formal and informal communication. Formal communications are official company sanctioned methods of communicating to the employees. The grapevine, rumor mill, etc. are some of the means of informal communication in the organization. The second grouping of communication techniques is based on the usage of words. Verbal communication includes use of words for communication via telephone, face to face, etc. Nonverbal communication conveys messages without the use of words through body language, facial expressions, etc. The last grouping of communication techniques is based on participation of the people involved in communication. One-way communication happens when information is relayed from the sender to the receiver without the expectation of a response like memos and announcements. Two-way communication is a method in which both parties are involved in the exchange of information. Team tools are a part of the team dynamics and performance. The various team tools that are used are brainstorming, nominal group technique, and multivoting. If getting your learning started is half the battle, what if you could do that for free? Visit Skill Up by SimplyLearn. Click on the link in the description to know more. This lesson will cover the details of the measure phase. The key objective of the measure phase is to gather as much information as possible on the current processes. This involves three key tasks that is creating a detailed process map, gathering baseline data and summarizing and analyzing the data. Let us understand process modeling in the following screen. Process modeling refers to the visualization of a proposed system layout or other change in the process. Process modeling and simulation can determine the effectiveness or ineffectiveness of a new design or process. They can be done using process mapping and flowcharts. We will learn about these in the forthcoming screens. Let us understand process mapping in this screen. Process mapping refers to a workflow diagram which gives a clear understanding of the process or a series of parallel processes. It is also known as process charting or flowcharting. Process mapping can be done either in the measure phase or the analyze phase. The features of process mapping are as follows. Process mapping is usually the first step in process improvement. Process mapping gives a wider perspective of the problems and opportunities for process improvement. It is a systematic way of recording all the activities performed. Process mapping can be done by using any of the methods like flowcharts, written procedures and detailed work instructions. Let us learn about flowchart in the following screen. A flowchart is a pictorial representation of all the steps of a process in consecutive order. It is used to plan a project, document processes and communicate the process methodology with others. There are many symbols used in a flowchart and the common symbols are shown in the given table. It is recommended you take a look at the symbols and their description for better understanding. Click the button to view an example of a flowchart. The given flowchart shows the processes involved in software development. The flowchart starts with the start box which connects to the design box. In a software project, a software design is followed by coding which is then followed by testing. In the next step, there is a check for errors. In case of errors, it is evaluated for the error type. If it is a design error, it goes back to the beginning of the design stage. If it is not a design error, it is then routed to the beginning of the coding stage. On the contrary, if there are no errors, the flowchart ends. Let us learn about written procedures in this screen. A written procedure is a step-by-step guide to direct the reader through a task. It is used when the process of a routine task is lengthy and complex and it is essential for everyone to strictly follow the rules. Written procedures can also be used when you want to know what is going on during product or process development phases. There are a number of benefits of documenting procedures. Writing procedures help you avoid mistakes and ensure consistency. They streamline the process and help your employees take relevant decisions and save a lot of time. Written procedures help in improving quality. They are simple to understand as they tend to describe the processes at a general level. In the next screen, we will discuss how work instructions are helpful in understanding the process in detail. Work instructions define how one or more activities involved in a procedure should be written in a detailed manner with the aid of technology or other resources like flowcharts. They provide step-by-step details for a sequence of activities organized in a logical format so that an employee can follow it easily and independently. For example, in the internal audit procedure, how to fill out the audit results report comes under work instructions. Selection of the three process mapping tools is based on the amount of detail involved in the process. For a less detailed process, you can select flowchart. And for a detailed process with lots of instructions, you can select work instructions. Click the button to view an example of work instructions. This example shows the work instructions for shipping electronic instruments. The company name is Nutri Worldwide Inc. The instructions are written by Brianna Scott and approved by Andrew Murphy. It is a one-page instruction. The work instructions are documented for the shipping of electronic instruments by the shipping department. The scope of the project states that it is applicable to shipping operations. The procedure is divided into three broad steps. As a first step, the order for the shipment must be prepared. In this step, the shipping person receives an order number from the sales department through an automatic order system. The quantity of the instrument and its card number are looked up from the system file and the packaging is done as per the instructions on the card. The next step is packaging. Special packing instructions must be checked. The instruments are then marked as per the instructions on the card and packed in a special or standard container as per the requirement. The order number is written in the shipping system and the packing list and shipping documentation are obtained. Finally, the quantity of instruments and the documents is checked. Let us understand process input and output variables in this screen. Any improvement of a process has a few prerequisites. To improve a process, the key process output variables KPOV and key process input variables KPIV should first be measured. Metrics for key process variables include percent defective operation cost, elapsed time, backlog quantity, and documentation errors. Critical variables are best identified by the process owners. Process owners know and understand each step of a process and are in a better position to identify the critical variables initially. Once identified, the relationship between the variables is depicted using tools such as cypo and cause and effect matrix. The process input variables results are compared to determine which input variables have the greatest effect on the output variables. Let us proceed to the next topic of this lesson. In the following screen, in this topic, we will discuss probability and statistics in detail. Let us learn about probability in the following screen. Probability refers to the chance of something occurring or happening. An outcome is the result of a single trial of an experiment. Suppose there are n possible outcomes that are equally likely. The probability that a specific type of event or outcome, say f, can occur is the number of specific outcomes divided by the total possible outcomes. Click the button to view an example of probability. In the event of tossing a coin, what is the probability of the occurrence of heads? A single trial of tossing a coin has two outcomes, heads and tails. Hence, the probability of heads occurring is 1 / two, the total number of outcomes. Let us look at some basic properties of probability in this screen. There are three basic properties of probability. Click each property to know more. Property one states that the probability of an event is always between 0 and one, both inclusive. According to property two, the probability of an event that cannot occur is zero. In other words, an event that cannot occur is called an impossible event. Property three states that the probability of an event that must occur is one. In other words, an event that must occur is called a certain event. If E is an event, then the probability of its occurrence is given by P of E. It is also read as the probability of event E. In this screen, let us look at some common terms used in probability along with an example. The commonly used terms in probability are sample space, vend diagram, and event. Sample space is the collection of all possible outcomes for a given experiment. In the coin example discussed earlier, the sample space consists of one instance each of heads and tails. If two coins are tossed, the sample space would be four in total. Event diagram shows all hypothetically possible logical relations between a finite collection of sets. An event is a collection of outcomes for an experiment, which is any subset of the sample space. Click the button to view an example of probability. What is the probability of getting a three followed by two when a dice is thrown twice? When the dice is thrown twice, the first throw can have any number from 1 to six. Similarly, the second throw can also have any number from 1 to six. So, the total sample space is 6 * 6 that is 36. The event in this case is 3 followed by 2. This can happen in only one way. So, the probability in the question is 1 / 36. Let us discuss the basic concepts of probability in this screen. Some basic concepts of probability are independent event, dependent event, mutually exclusive and mutually inclusive events. Click each concept to know more. When the probability of occurrence of an event does not affect the probability of occurrence of another event, the two events are said to be independent. Suppose you rolled a dice and flipped a coin at the same time. The probability of getting any number on the dice in no way influences the probability of getting heads or tails on the coin. When the probability of one event occurring influences the likelihood of the other event, the events are said to be dependent. Events are said to be mutually exclusive if the occurrence of any one of them prevents the occurrence of all the others. In other words, only one event can occur at a time. Consider an example of flipping a coin. When you flip a coin, you will either get heads or tails, but not both. You can add the probabilities of these two events to prove they are mutually exclusive. Any two events wherein one event cannot occur without the other are said to be mutually inclusive events. In this screen, let us learn about the multiplication rules also known as and rules. The multiplication rules or and rules depend on the event dependency. For independent events, that is if two events are independent of each other, the special multiplication rule applies. For mutually independent events, the special multiplication rule is as follows. If the events A, B, C and so on are independent of each other, then the probability of A and B and C and so on is equal to the product of their individual probabilities. Click the button to view an example of this rule. Suppose there are three events which are independent of each other such as the event of flipping a coin and getting heads, drawing a card and getting an ace and throwing a dice and getting a one. What is the probability of occurrence of all these events? The answer is the probability of A and B and C is equal to the product of their individual probabilities which is half ultiplied by 113th ultiplied by 16. The result is 0.64 which is 0.64%. Hence there is 0.64% probability of all of the events occurring. We will continue the discussion on multiplication rules in this screen. The multiplication rule for non-independent or conditional events which is also the general multiplication rule is as follows. If a and b are two events then the probability of a and b is equal to the product of probability of a and the probability of b given a. Alternatively, we can say that for any two events, their joint probability is equal to the probability that one of these events occurs multiplied with the conditional probability of the other event given the first event. Click the button to view an example of this rule. A bag contains six golden coins and four silver coins. Two coins are drawn without replacement from the bag. What is the probability that both of the coins are silver? Let A be the event that the first coin is silver and B be the event that the second coin is silver. There are 10 coins in the bag, four of which are silver. Therefore, P of A equals 4 / 10. After the first selection, there are nine coins in the bag, three of which are silver. Therefore, P of B given A= 3 / 9. Therefore, based on the rule of multiplication, probability of A intersection B = 4 / 10 * 3 / 9. The answer is 12 / 90, which is 0.1334. Hence, there is 13% probability that both the coins are silver. In this screen, we will look at the definitions and formula of permutation and combination. Permutation is the total number of ways in which a set, group or number of things can be arranged. The order matters to a great extent in permutation. The manner in which the objects or numbers are arranged will be considered in permutation. The formula for permutation is np r= p of n and r= n factorial / n minus r factorial where n is the number of objects and r is the number of objects taken at a time. The unordered arrangement of set group or number of things is known as combination. The order does not matter in combination. The formula for combination is n c= c of n and r = n factorial / r factorial multiplied by n - r factorial where n is the number of objects and r is the number of objects taken at a time. Let us look at an example for calculating permutation and combination in the following screen. From a group of 10 employees, a company has to select four for a particular project. In how many ways can the selection happen given the following conditions? When the arrangements of employees needs to be different. When the arrangement of employees need not be different. Click the button to know the answer. In the given example, the values of n and r are 10 and four respectively. Let us consider the first condition. From a group of 10 employees, four employees need to be selected. The arrangement needs to be different. Using the permutation formula, NP R= P of N and R= N factorial / N - R factorial. 10 P4 = P of 10 and 4 = 10 factorial / 10 - 4 factorial = 540. Therefore, the four employees can be selected in 540 ways. Let us now consider the second condition. From a group of 10 employees, four employees need to be selected. The arrangement of employees need not be different. Using the combination formula ncr= c of n and r= n factorial / r factorial ultiplied by n - r factorial 10 c4 = c of 10 and 4 = 10 factorial / 4 factorial * 10 - 4 factorial = 210. Therefore, the four employees can be selected from a group of 10 employees in 210 different ways. Let us understand the two types of statistics in this screen. Statistics refers to the science of collection, analysis, interpretation and presentation of data. In six sigma, statistical methods and principles are used to measure and analyze the process performance and improvements. There are two major types of statistics. Descriptive statistics and inferential statistics. Descriptive statistics is also known as enumerative statistics and inferential statistics is also known as analytical statistics. Descriptive statistics include organizing, summarizing and presenting the data in a meaningful way. Whereas inferial statistics includes making inferences and drawing conclusions from the data. Descriptive statistics describes what's going on in the data. The main objective of inferial statistics is to make inferences from the data to more general conditions. Histograms, pie charts, box plots, frequency distributions, and measures of central tendency, mean, median, and mode are all examples of descriptive statistics. On the other hand, examples of inferial statistics are hypothesis testing, scatter diagrams, etc. The main objective of statistical inference is to draw conclusions on population characteristics based on the information available in the sample. Collecting data from a population is not always easy, especially if the size of the population is big. The easier way is to collect a sample from the population and from the sample statistic collected make an assessment about the population parameter. Click the button to see an example of statistical inference. The management team of a cricket council wants to know if the team's performance has improved after recruiting a new coach. The management conducts a test to prove this statistically. Let us consider YA and YB where YA stands for efficiency of coach A and YB stands for efficiency of coach B. To conduct the test, the basic assumption is coach A and coach B are both effective. This basic assumption is known as null hypothesis. Here let us assume the status quo is null hypothesis. Hence null hypothesis HO can be given by Y A equals YB. The management team also challenges their basic assumption by assuming the coaches are not equally effective. This is their alternate hypothesis. The alternate hypothesis states that the efficiencies of the two coaches differ. If the null hypothesis is proven wrong, the alternate hypothesis must be right. Hence, alternate hypothesis H1 can be given Y a is not equal to YB. These hypothesis statements are used in a hypothesis test which will be discussed in the later part of the course. In this screen, we will learn about the types of errors. When collecting data from a population as a sample and forming a conclusion on the population based on the sample, you run into the risk of committing errors. There are two possible errors that can happen. Type one error and type two error. The type one error occurs when the null hypothesis is rejected when it is in fact true. Type one error is also known as producers risk. The chance of committing a type one error is known as alpha. Alpha or significance level is the chance of committing a type 1 error and is typically chosen to be 5%. This means the maximum amount of risk you have for committing a type 1 error is 5%. Let us consider the previous example. Arriving at a conclusion that coach B is better than coach A when in fact they are at the same level is a type one error. The risk you have of committing this error is 5%. Which means there is a 5% chance your experiment can give wrong results. The type two error occurs when the null hypothesis is accepted when it is in fact false. Also, when you reject the alternate hypothesis when it is actually true, you commit a type two error. Type two error is also referred to as consumer's risk. In comparing the two coaches, the coaches were actually different in their efficiencies, but the conclusion was that they are the same. The chance of committing a type two error is known as beta. The maximum chance of committing a type two error is 20%. In the next screen, we will learn about central limit theorem. Central limit theorem CLT states that for a sample size greater than 30, the sample mean is very close to the population mean. In simple words, the sample mean approaches the normal distribution. For example, if you have sample one and its mean is mean one, sample two and its mean is mean 2 and so on. Take the means of mean one, mean two, etc. and you will find that it is the same as the population mean. Population mean is the average of the sample means. In such cases, the standard error of mean also known as SEM that represents the variability between the sample means is very less. The SEM is often used to represent the standard deviation of the sample. The formula for SEM is population standard deviation divided by the square root of the sample size. Selecting a sample size also depends on the concept called power also known as power of the test. We will cover this concept in detail in the later part of the course. Let us look at the graphical representation of the central limit theorem in the following screen. The plot of the three numbers 2, three, and four looks as shown in the graph. It is interesting to note that the total number of times each digit is chosen is six. When the plot of the sample mean of nine samples of size two each is drawn, it looks like the red line which is plotted in the figure. The x-axis shows numbers of the mean which are 2, 2.5, 3, and four. On the yaxis, the frequency is plotted. The point at which arrows from number two and three converge is the mean of two and three. Similarly, the point at which arrows from two and four converge is the mean of the numbers two and four. Let us discuss the concluding points of the central limit theorem in the next screen. The central limit theorem concludes that the sampling distributions are helpful in dealing with non-normal data. If you take the sample data points from a population and plot the distribution of the means of the sample, you get the sampling distribution of the means. The mean of the sampling distribution, also known as the mean of means, will be equal to the population mean. Also, the sampling distribution approaches normality as the sample size increases. Note that CLT enables you to draw inferences from the sample statistics about the population parameters. This is irrespective of the distribution of the population. CLT also becomes the basis for calculating confidence interval for hypothesis tests as it allows the use of a standard normal table. Let us proceed to the next topic of this lesson in the following screen. In this topic, we will cover the concept of statistical distributions. Let us start with discrete probability distribution in the following screen. Discrete probability distribution is characterized by the probability mass function. It is important to be familiar with discrete distributions while dealing with discrete data. Some of the examples of discrete probability distribution are binomial distribution, pant distribution, negative binomial distribution, geometric distribution and hypergeometric distribution. We will focus only on the two most useful discrete distributions. Binomial distribution and pal distribution. Like most probability distributions, these distributions also help in predicting the sample behavior that has been observed in a population. Let us learn about binomial distribution in the following screen. Binomial distribution is a probability distribution for discrete data named after the Swiss mathematician Jacob Bernoli. It is an application of popular knowledge to predict the sample behavior. Binomial distribution also describes the discrete data as a result of a particular process like the tossing of a coin for a fixed number of times and the success or failure in an interview. A process is known as Bernoli's process when the process output has only two possible values like defective or okay, pass or fail and yes or no. Binomial distribution is used to deal with defective items. Defect is any non-compliance with a specification. Defective is a product or service with at least one defect. Binomial distribution is most suitable when the sample size is less than 30 and less than 10% of the population. It is the percentage of non-deective items provided the probability of creating a defective item remains the same over a period. Let us look at the equation. The probability of exactly R successes out of a sample size of N is denoted by P of R which is equal to N C R whole whole multiplied by P to the power of R and 1 minus P whole to the power of N minus R. In the equation P is the probability of success. R is the number of successes desired and N is the sample size. To continue discussing the binomial distribution, let us look at some of its key calculations in the following screen. The mean of a binomial distribution is denoted by mio and is given by n multiplied by p. The standard deviation of a binomial distribution is denoted by sigma which is equal to n ultiplied p multiplied by 1 minus p. The method of calculating factorials say factorial of 5 is the product of 5 4 3 2 and 1 which is equal to 120. Similarly factorial of 4 is the product of 4 3 2 and 1 which is equal to 24. Let us look at an example of calculating binomial distribution in the next screen. Suppose you wish to know the probability of getting heads five times in eight coin tosses. You can use the binomial equation for the same. Click the answer button to see how this is done. The tossing of a coin has only two outcomes, heads and tails. It means that the probability of each outcome is 0.5 and it remains fixed over a period of time. Additionally, the outcomes are statistically independent. In this case, the probability of success denoted by P is 0.5. The number of successes desired is denoted by R, which is five. And the sample size is denoted by N, which is 8. Therefore the probability of five heads is equal to factorial of 8 CR which is 8 / factorial of 5 and factorial of 8 - 5 whole multiplied by 0.5 to the power of 5 * 1 - 0.5 whole to the power of 8 - 5. This calculation gives a result of 0.2187 which is equal to 21.87%. Let us learn about pon distribution in this screen. Pson distribution is named after Simeon deni pon and is also used for discrete data. Pson distribution is an application of the population knowledge to predict the sample behavior. It is generally used for describing the probability distribution of an event with respect to time or space. Some of the characteristics of person distribution are as follows. Person distribution describes the discrete data resulting from a process like the number of calls received by a call center agent or the number of accidents at a signal. Unlike binomial distribution which deals with binary discrete data, person distribution deals with integers which can take any value. Pson distribution is suitable for analyzing situations wherein the number of trials similar to the sample size in binomial distribution is large and tends towards infinity. Additionally, it is used in situations where the probability of success in each trial is very small almost tending towards zero. This is the reason why puson distribution is applicable for predicting the occurrence of rare events like plane crashes, car accidents etc and is therefore widely used in the insurance sector. Pone distribution can be used for predicting the number of defects as well given a low defect occurrence rate. Let us look at the formula for calculating pon distribution in the next screen. The pon distribution for a probability of exactly x occurrences is given by p of x= to lambda to the power of x multiplied with log e to the power of minus lambda whole / factorial of x. In this equation, lambda is the mean number of occurrences during the interval. X is the number of occurrences desired and E is the base of natural logarithm which is equal to 2.71828. The mean of the pson distribution is given by the lambda and the standard deviation of a posson distribution is given by sigma which is the square root of lambda. Let us look at an example to calculate poson distribution in the next screen. The past records of a road junction which is accidentprone show a mean number of five accidents per week at this junction. Assume that the number of accidents follows a pson distribution and calculate the probability of any number of accidents happening in a week. Click the button to know the answer. Given the situation you know that the value of lambda or mean is five. So p of 0 that is the probability of zero accidents per week is calculated as 5 to the power of 0 multiplied by e to the power of -5 whole divided by factorial of 0. The answer is 0.6. Applying the same formula the probability of one accident per week is 0.03. The probability of more than two accidents per week is 1 minus the sum of probabilities of 0 1 and two accidents which is 0.884. In other words, the probability is 88.4%. Let us learn about normal distribution in this screen. The normal or Gaussian distribution is a continuous probability distribution. The normal distribution is represented as N and depends on two factors. Mu which stands for mean and sigma which gives the standard deviation of the data points. Normal distribution normally has a higher frequency of values around the mean and lesser occurrences away from it. It is often used as a first approximation to describe real valued random variables that tend to cluster around a single mean value. The distribution is bell-shaped and symmetrical. The total area under the normal curve is one which is P of X. Various types of data such as body weight, height, the output of a manufacturing device, etc. follow the normal distribution. Additionally, normal distribution is continuous and symmetrical with the tails asic to the x-axis, which means they touch the xaxis at infinity. Let us continue to discuss normal distribution in the following screen. In a normal distribution to standardize comparisons of dispersion or the different measurement units like inches, meters, grams, etc., a standard Z variable is used. The uses of ZV value are as follows. While the value of Z or the number of standard deviations is unique for each probability within the normal distribution, it helps in finding probabilities of data points anywhere within the distribution. It is dimensionless as well. That is it has no units such as millime, liters, colum etc. There are different formulas to arrive at the normal distribution. We will focus on one commonly used formula for calculating normal distribution which is Z = Y minus mu whole divided by sigma. Here Z is the number of standard deviations between Y and the mean denoted by mu. Y is the value of the data point in concern. Mu is mean of the population or data points and sigma is the standard deviation of the population or data points. Let us look at an example for calculating normal distribution in the following screen. Suppose the time taken to resolve customer problems follows a normal distribution with a mean of 250 hours and standard deviation of 23 hours. Find the probability of a problem resolution taking more than 300 hours. Click the button to know the answer. In this case, Y is equal to 300, miu= 250, and sigma= 23. Applying the normal distribution formula, Z is equal to 300 - 250 whole / 23. The result is 2.17. When you look at the normal distribution table, the Z value of 2.17 covers an area of 0.98499 under itself. This means the probability of a problem taking 0 to 300 hours to be resolved is 98.5%. And therefore the chances of a problem resolution taking more than 300 hours is 1.5%. Let us understand the usage of Ztable in this screen. The graphical representation of Ztable usage is given here. The probability of areas under the curve is one. For the actual value, one can identify the zcore by using the z table. As shown, this probability is the area under the curve to the left of point plus a to zero. Using the actual data, when you calculate mean and standard deviation and the values are 25 and five respectively, it is the normal distribution. If the same data is standardized to a mean value of zero and standard deviation value of one, it is the standard normal distribution. In the next screen, we will take a look at the Z table. The Z table gives the probability that Z is between zero and a positive number. There are different forms of normal distribution Z tables followed globally. The most common form of Z table with positive Zcores is shown here. The value of A called the percentage point is given along the borders of the table in bold and is to two decimal places. The values in the main table are the probabilities that Z is between zero and plus A. Note that the values running down the table are to one decimal place. The numbers along the column change only for the second decimal place. Let us look at some examples on how to use a Z table. In the following screen, let us find the value of P of Z less than zero. The table is not needed to find the answer once we know that the variable Z takes a value less than or equal to zero. First, the area under the curve is one. And second, the curve is symmetrical about Z equals 0. Hence, there is 0.5 or 50% above chance of Z equals 0 and 0.5 or 50% below chance of Z equals Z. Let us find the value of P of Z greater than 1.12. In this case, the chance of Z is greater than a number. In this case, 1.12. You can find this by using the following fact. The opposite or complement of an event of A is the event of not A. That is the opposite or complement of event A occurring is the event A not occurring. Its probability is given by P of not equal A= 1US P of A. In other words, P of Z greater than 1.12 is 1 minus the opposite, which is P of Z lesser than 1.12. Using the table P of Z less than 1.12 = 0.5 + P of 0 less than Z less than 1.12 = 0.5 + 0.3686, which is 0.8686. Hence the answer is P of Z greater than 1.12 = 1 minus 0.8686 which is 0.1314. Note the answer is less than 0.5. Let us find the value of P of Z lies between 0 and 1.12. In this case where Z falls within an interval, the probability can be read straight off the table. P of Z lies between 0 and 1.12 equals 0.3686. We will learn about ki squar distribution in this screen. Ki square distribution is also known as ki squared or kiquare distribution. Ki squar with k minus one degrees of freedom is the distribution of a sum of the squares of k independent standard normal random variables. The kiquare distribution is one of the most widely used probability distributions in inferial statistics. It is also known as hypothesis testing and the distribution is used in hypothesis tests. When used in hypothesis tests, it only needs one sample for the test to be conducted. Conventionally, degree of freedom is k minus one where k is the sample size. For example, if W, X, Y, and Z are four random variables with standard normal distributions, then the random variable F, which is the sum of W ^2, X², Y square, and Z square, has a kiquare distribution. The degrees of the freedom of the distribution DF equals the number of normally distributed variables used. In this case, DF is equal to four. Let us look at the formula to calculate kiquare distribution in the following screen. Ki square calculated or sigma or the ki square index equals f of o minus f of e whole squar / f of e. Here f of o stands for an observed frequency and f of e stands for an expected frequency determined through a contingency table. Let us understand t distribution in the next screen. The t distribution method is the most appropriate method to be used in the following situations. When you have a sample size of less than 30. When the population standard deviation is not known. When the population is approximately normal. Unlike the normal distribution, a t distribution is lower at the mean and higher at the tails as seen in the image. T distribution is used for hypothesis testing. Also, as seen in the image, the t distribution is symmetrical in shape but flatter than the normal distribution. As the sample size increases, the t distribution approaches normality. For every possible sample size or degrees of freedom, there is a different t distribution. Let us learn about F distribution in the following screen. The F distribution is a ratio of two kiquare distributions. A specific F distribution is denoted by the ratio of the degrees of freedom for the numerator K square and the degrees of freedom for the denominator K square. The F test is performed to calculate and observe if the standard deviations or variances of two processes are significantly different. The project teams are usually concerned about reducing the process variance. As per the formula, F calculated equals S1 squar / S2 squared where S1 and S2 are the standard deviations of the two samples. If the f calculated is one, it implies there is no difference in the variance. If s_ub_1 is greater than s_ub_2, then the numerator must be greater than the denominator. In other words, df1 = n1 minus1 and df_2 = n_sub_2 minus1. From the F distribution table, you can easily find out the critical F distribution at alpha and the degrees of freedom of the samples of two different processes DF1 and DF2. Let us proceed to the next topic of this lesson in the following screen. In this topic, we will discuss collecting and summarizing data in detail. Let us learn about types of data in the following screen. Data is objective information which everyone can agree on. It is a collection of facts from which conclusions may be drawn. The two types of data are attribute data and variable data. Click each type to know more. Discrete data is data that can be counted and only includes numbers such as 2, 40 or,50. Attribute data is commonly called pass fail or good bad data. Attribute or discrete data cannot be broken down into a smaller unit meaningfully. It answers questions such as how many, how often, or what type. Some examples of attribute data are number of defective products, percentage of defective products, frequency at which a machine is repaired, or the type of award received. Any data that can be measured on a continuous scale is continuous or variable data. This type of data answers questions such as how long, what volume, or how far. Examples of continuous data include height, weight, time taken to complete a task, temperature and so on. Let us understand the importance of selecting the data type in this screen. Deciding the data type facilitates analysis and interpretation. Therefore, the first step in the measure phase is to determine what type of data should be collected. This can be done by considering the following. The first consideration is to identify what is already known. For this, the values already identified for the process are listed. These include critical to quality parameters or CTQs, key process output variables or KPOVs and the key process input variable or KPIVs. Next, to understand how to proceed with the data gathered, it is necessary to determine the data type that fits the metrics for the key variables identified. The question now arises, why should the data type be identified? This is important as it enables the right set of data to be collected, analyzed, and used to draw inferences. It is not advisable to convert one type of data into another. Converting attribute data to variable data is difficult and requires assumptions to be made about the process. It may also require additional data gathering including retesting units. Let us look at measurement scales in the following screen. There are four measurement scales arranged in the table in increasing order of their statistical desiraability. In the nominal scale, the data consists of only names or categories and there is no possibility of ordering. An example of this type of measurement can be a bag of colored balls which contains 10 green balls, five black balls, eight yellow balls, an
Original Description
🔥Lean Six Sigma Expert - https://www.simplilearn.com/lean-six-sigma-expert-masters-program?utm_campaign=ZK5rHpATk90&utm_medium=DescriptionFirstFold&utm_source=Youtube
In this Six Sigma Full Course 2026 Video, we'll teach you everything you need to know about Six Sigma and its underlying concepts in detail! Starting with Lean Six Sigma Explained with Six Sigma Green Belt Training including proper references. Excel in process improvement and quality management with our comprehensive Six Sigma Full Course, providing in-depth training on key methodologies. By the end of this video all your doubts related to lean six sigma would be cleared.
So without further ado, let’s jump in.
00:00:00 - Introduction to Six Sigma Full Course 2026
00:21:28 - What is project management
00:17:10 - What is Six Sigma
00:19:26 - Introduction to six sigma Methodologies
00:32:17 - 5 S Methodology
00:40:55 - green belt training
06:53:31 - 12 Agile principles explained
07:09:38 - Six sigma interview questions
07:33:51 - Top 10 PM Tools
✅Subscribe to our Channel to learn more about the top Technologies: https://bit.ly/2VT4WtH
⏩ Check out the Six Sigma training videos: https://www.youtube.com/playlist?list=PLEiEAq2VkUUIPW1oBXy5PNbdeV1frCQkT
#SixSigmaFullCourse #LeanSixSigma #SixSigmaGreenBeltTraining #WhatIsLearnSixSigma #LeanSixSigmaExplained #LeanSixSigmaExplainedSimply #LeanSixSigmaTraining #Simplilearn
Learn to develop your organizational projects with the Lean Six Sigma Green Belt certification online program. Aligned to the IASSC exam, this online six sigma certification integrates lean and the DMAIC methodology with case studies to provide you the skills required for an organization's growth.
➡️About Lean Six Sigma Expert
With the Lean Six Sigma Expert Program, you can become a specialist in process improvement and quality management. You will gain expertise in the DMAIC framework and advanced tools like Minitab for effective data analysis. Drive efficiency with a deep understan
Playlist
Uploads from Simplilearn · Simplilearn · 47 of 60
1
 2
2
 3
3
 4
4
 5
5
 6
6
 7
7
 8
8
 9
9
 10
10
 11
11
 12
12
 13
13
 14
14
 15
15
 16
16
 17
17
 18
18
 19
19
 20
20
 21
21
 22
22
 23
23
 24
24
 25
25
 26
26
 27
27
 28
28
 29
29
 30
30
 31
31
 32
32
 33
33
 34
34
 35
35
 36
36
 37
37
 38
38
 39
39
 40
40
 41
41
 42
42
 43
43
 44
44
 45
45
 46
46
 ▶
▶
 48
48
 49
49
 50
50
 51
51
 52
52
 53
53
 54
54
 55
55
 56
56
 57
57
 58
58
 59
59
 60
60

Ethical Hacking Full Course 2026 | Ethical Hacking Course for Beginners | Simplilearn
Simplilearn
AWS Full Course 2026 | AWS Cloud Computing Tutorial for Beginners | AWS Training | Simplilearn
Simplilearn
Data Structures And Algorithms Full Course | Data Structures and Algorithms Tutorial | Simplilearn
Simplilearn
SQL Full Course 2026 | SQL Tutorial for Beginners | SQL Beginner to Advanced Training | Simplilearn
Simplilearn
Microsoft Azure Full Course 2026 | Azure Tutorial for Beginners | Azure Training | Simplilearn
Simplilearn
Shopify Tutorial For Beginners 2026 | Shopify Course | shopify dropshipping | Simplilearn
Simplilearn
Six Sigma Full Course 2026 | Six Sigma Green Belt Training | Six Sigma Training | Simplilearn
Simplilearn
🔥Feeling Stuck? How Upskilling Can Boost Your Career! #shorts #simplilearn
Simplilearn
Growth Hacking In Marketing | Learn Growth Hacking Marketing Strategies | Simplilearn
Simplilearn
🔥Cracked 3 Job Offers with One AIML Course! | 20–30% Salary Hike #shorts #simplilearn
Simplilearn
Top 10 Must-Have Figma Plugins for UI/UX Designers in 2026 | Figma Plugins | Simplilearn
Simplilearn
Business Analytics Full Course 2026 | Business Analytics Tutorial For Beginners | Simplilearn
Simplilearn
Simplilearn Reviews | Getting future-ready with course in Artificial Intelligence | Roopam’s story
Simplilearn
Generative AI Full Course 2026 | Gen AI Tutorial for Beginners | Gen AI Explained | Simplilearn
Simplilearn
Full Stack Developer Course 2026 | Full Stack Java Developer Tutorial for Beginners | Simplilearn
Simplilearn
Simplilearn Reviews | How David Went From Seasoned Engineer to AI Innovator #GetCertifiedGetAhead
Simplilearn
Complete Social Media Marketing Strategy for 2026 | Social Media Marketing Strategy | Simplilearn
Simplilearn
🔥Top 4 Cybersecurity Certifications You Need! #simplilearn #shorts
Simplilearn
🔥Cloud Engineer Salary in India 2026 | City-Wise Breakdown #shorts #simplilearn
Simplilearn
Digital Marketing Full Course 2026 | Digital Marketing Tutorial For Beginners | Simplilearn
Simplilearn
Full Stack Java Developer Course | Full Stack Java Developer Tutorial for Beginners | Simplilearn
Simplilearn
Social Media Marketing Full Course | Social Media Marketing Tutorial For Beginners | Simplilearn
Simplilearn
How To Create LLM Chatbot Demo 2026 | Build a LLM Chatbot From Scratch | Simplilearn
Simplilearn
Digital Supply Chain Management Certification | Supply Chain Management Course | Simplilearn
Simplilearn
AI Agents Full Course 2026 | AI Agents Tutorial for Beginners | How to Build AI Agents | Simplilearn
Simplilearn
ITIL Full Course 2026 | ITIL 4 Foundation Course | ITIL Tutorial For Beginners | Simplilearn
Simplilearn
Generative AI Full Course 2026 | Gen AI Tutorial for Beginners | Gen AI Explained | Simplilearn
Simplilearn
ITIL Full Course 2026 | ITIL 4 Foundation Course | ITIL Tutorial For Beginners | Simplilearn
Simplilearn
Simplilearn Reviews | Integrating AI & Music | Diego's Story
Simplilearn
Digital Marketing Full Course 2026 | Digital Marketing Tutorial For Beginners | Simplilearn
Simplilearn
SEO Full Course 2026 | SEO Tutorial for Beginners | SEO Training | SEO Explained | Simplilearn
Simplilearn
PMP Vs CAPM: Which Certification Should You Choose? | PMP Vs CAPM | Simplilearn
Simplilearn
Complete Data Analyst Roadmap 2026 | How To Become A Data Analayst In 2026 | Simplilearn
Simplilearn
Generative AI Full Course 2026 | Gen AI Tutorial for Beginners | Gen AI Explained | Simplilearn
Simplilearn
🔥5 Jobs That Are Most Likely Safe from Layoffs in Today’s Market #shorts #simplilearn
Simplilearn
🔥Git vs GitHub – What's the Difference?
Simplilearn
What Goes Behind Building the Likes of Uber and Netflix? | Product Management Tutorial | Simplilearn
Simplilearn
AI Agents Full Course 2026 | AI Agents Tutorial for Beginners | How to Build AI Agents | Simplilearn
Simplilearn
Full Stack Developer Course 2026 | Full Stack Java Developer Tutorial for Beginners | Simplilearn
Simplilearn
Product Life Cycle 2025 | Stages Of Product Life Cycle | Product Life Cycle Tutorial | Simplilearn
Simplilearn
Project Management Full Course 2026 | Project Management Tutorial | PMP Course | Simplilearn
Simplilearn
PCB Design Course 2025 | PCB Designing Explained | How To Make PCBs | Simplilearn
Simplilearn
Python Full Course 2026 | Python Data Analytics Tutorial For Beginners | Simplilearn
Simplilearn
🔥Top Product Management Skills You Need to Succeed in 2026 #shorts #simplilearn
Simplilearn
SQL For Data Analytics 2026 | Essential SQL Commands | SQL Tutorial For Beginners | Simplilearn
Simplilearn
Simplilearn Reviews | Paving Way To Success With AI & ML Course | Soumik’s Upskilling Journey
Simplilearn
Six Sigma Full Course 2026 | Six Sigma Green Belt Training | Six Sigma Training | Simplilearn
Simplilearn
Learn Snowflake In 45 Mins | Snowflake Tutorial | What Is Snowflake | Snowflake Explained
Simplilearn
🔥ML Career Tip – How to Start Learning Machine Learning in 60 Seconds! #shorts#simplilearn
Simplilearn
🔥Agile vs Waterfall in 60 Seconds #shorts #simplilearn
Simplilearn
Excel Full Course 2026 | Excel Tutorial For Beginners | Microsoft Excel Course | Simplilearn
Simplilearn
What Are AI Agents? | Types Of AI Agents | AI Agents Explained | AI Agents Tutorial | Simplilearn
Simplilearn
How To Create a Product Roadmap In 2026 | Product Roadmap | What Is Product Roadmap | Simplilearn
Simplilearn
SQL Full Course 2026 | SQL Tutorial for Beginners | SQL Beginner to Advanced Training | Simplilearn
Simplilearn
🔥What Is Phishing? #shorts #simplilearn
Simplilearn
Cloud Computing Full Course 2026 | Cloud Computing Tutorial | Cloud Computing Course | Simplilearn
Simplilearn
Simplilearn Reviews | Overcoming Rejection & career plateau to finding a New Job : Bhaskar Banerji
Simplilearn
Six Sigma Full Course 2026 | Six Sigma Green Belt Training | Six Sigma Training | Simplilearn
Simplilearn
Generative AI Full Course 2026 | Gen AI Tutorial for Beginners | Gen AI Explained | Simplilearn
Simplilearn
VLSI Design Course 2026 | VLSI Tutorial For Beginners | VLSI Physical Design | Simplilearn
Simplilearn
More on: PM Basics
View skill →




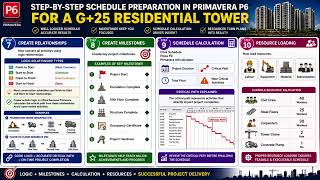


Related Reads
📰
📰
📰
📰
Apple Has a New CEO. Today Is Day 1. Here’s What Changes — and What Doesn’t.
Medium · Startup
Your Promo Case Wasn't Judged on Its Own Merits. It Was Judged Against Whoever Went Before You.
Dev.to · speed engineer
Five Files, No Record of Which Came First
Dev.to · Elliot James
Managing Software by Watching the River, Not the Photograph
Medium · AI
Chapters (9)
Introduction to Six Sigma Full Course 2026
21:28
What is project management
17:10
What is Six Sigma
19:26
Introduction to six sigma Methodologies
32:17
5 S Methodology
40:55
green belt training
6:53:31
12 Agile principles explained
7:09:38
Six sigma interview questions
7:33:51
Top 10 PM Tools
🎓
Tutor Explanation

 DeepCamp AI