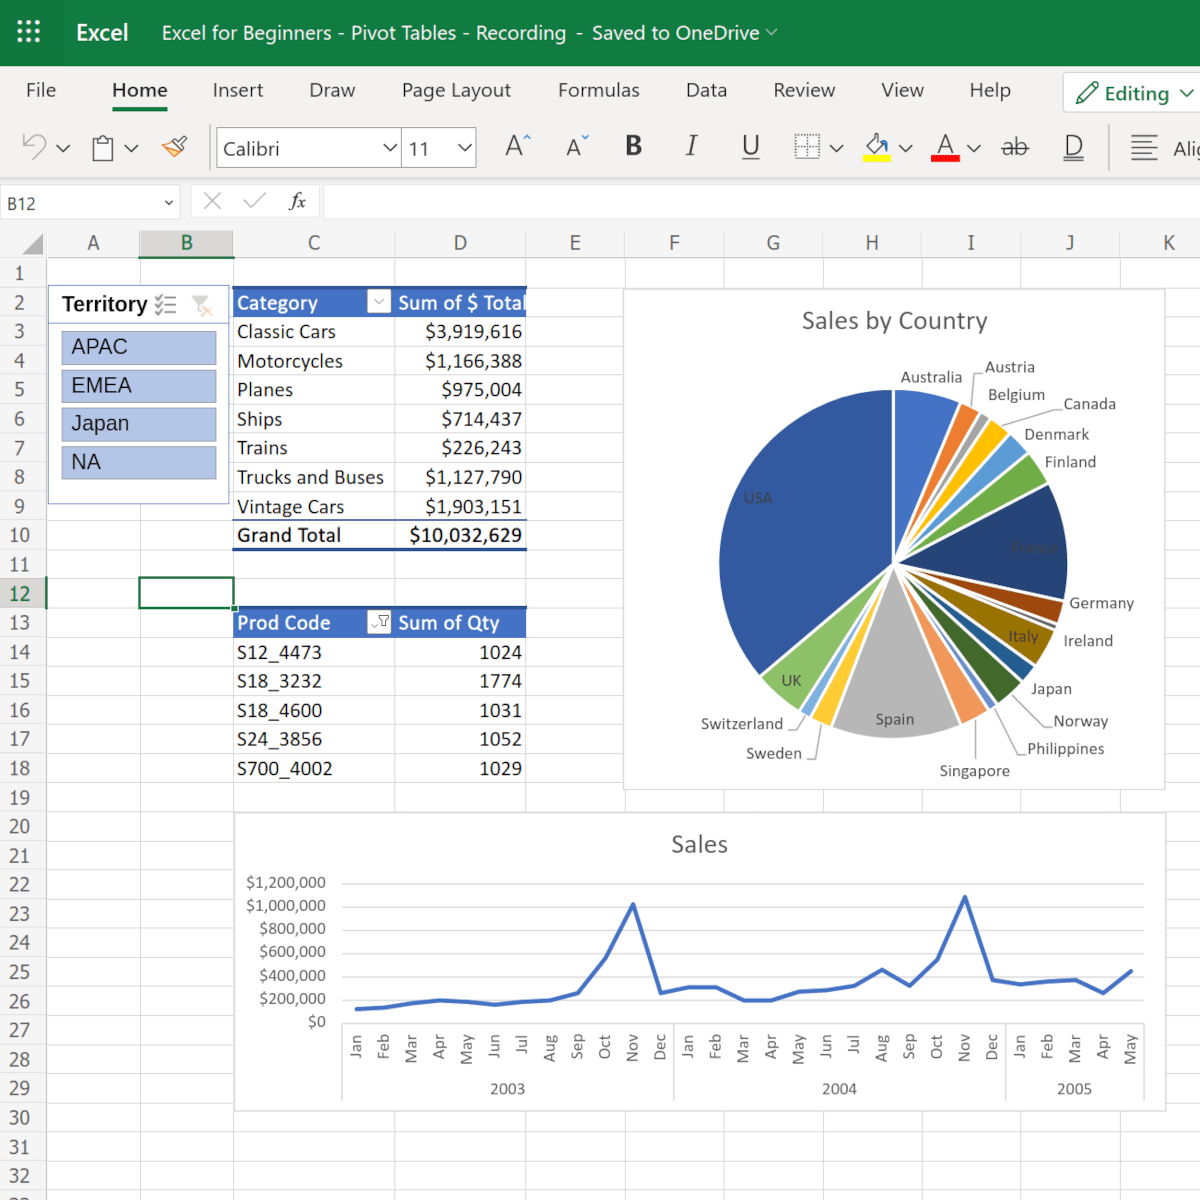
Excel for Beginners: Pivot Tables
Key Takeaways
Creates pivot tables using Excel on the Web for data analysis and visualization
Original Description
This 1-hour, project-based course introduces learners to the powerful pivot table feature of most spreadsheet applications. We’ll be using Excel on the Web in this project, which is the free spreadsheet application offered by Microsoft. However, many of the concepts that you will learn in this project will be applicable to other spreadsheet programs, such as LibreOffice Calc and Google Sheets.
We will cover the following concepts in a hands-on manner:
- Introduction to the functionality of pivot tables.
- Application of pivot tables to quickly summarize large amounts of raw data in detail.
- Visualize generated data from pivot tables for accessible information at a glance using charts.
Please Note: If you don't have a free Microsoft account, you will need to create one to be able to complete the content.
Watch on External: Coursera ↗
(saves to browser)
Sign in to unlock AI tutor explanation · ⚡30
More on: Excel & Spreadsheets
View skill →







Related Reads
📰
📰
📰
📰
Boosting Startups with Data Science: A Practical Guide to Data-Driven Growth
Medium · Startup
One Lake, Five Patterns: Rethinking the Enterprise Data Foundation
Medium · Data Science
The Python Automation Libraries That Changed How I Build Data Workflows
Medium · Machine Learning
The Python Automation Libraries That Changed How I Build Data Workflows
Medium · Data Science
🎓
Tutor Explanation

 DeepCamp AI