Excel & Spreadsheets
Perform data analysis with Excel or Google Sheets — formulas, pivot tables, and charts.
0%
Confidence · no data yet
After this skill you can…
- Build a dynamic dashboard with pivot tables and slicers
- Use VLOOKUP, INDEX-MATCH, and array formulas
- Create automated reports with named ranges and conditional formatting
Watch (10 videos)

Amazing Excel Trick! Unlock Hidden Features & Boost Productivity
→ Create efficient spreadsheets→ Utilize Excel shortcuts and tips

How to Align and Wrap Text in Excel
→ Use Excel formatting tools→ Apply text alignment and wrapping techniques

Spreadsheets Tutorial : Pivot Table Values
→ Create a pivot table in Excel→ Add values to a pivot table

Excel Challenge: Count Alphabets, Numbers & Special Characters Like a Pro!
→ Count characters in Excel→ Extract special characters from text→ Automate data processing with Excel formulas

Cara Mudah Buat Conditional Formatting di Excel
→ Create conditional formatting rules→ Apply formatting to Excel cells

Pivot Table for CA, ACCA, CMA & Accountants in Excel
→ Design spreadsheets with Pivot Tables→ Use Excel for advanced financial analysis

Trend Analysis in Excel
→ Use Excel for data analysis and trend analysis

Solusi Kantor: Bagaimana menggunakan fungsi INDEX MATCH di Excel
→ Use INDEX MATCH to retrieve data→ Manipulate data in Excel worksheets

Essential Excel Shortcuts | Navigate 1000+ Rows Efficiently
→ Navigate 1000+ rows efficiently in Excel→ Use Freeze Panes and keyboard shortcuts
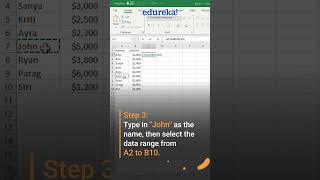
VLOOKUP in Excel | Learn How to Use VLOOKUP Function in 1 Minute | #edureka #excel #vlookup
→ Use VLOOKUP function in Excel→ Perform data lookup operations