Trend Analysis in Excel
Key Takeaways
Teaches trend analysis in Excel for pattern discovery
Original Description
👉Sign up for Our Complete Data Science Training with 57% OFF: https://bit.ly/3sJATc9
👉 Download Our Free Data Science Career Guide: https://bit.ly/47Eh6d5
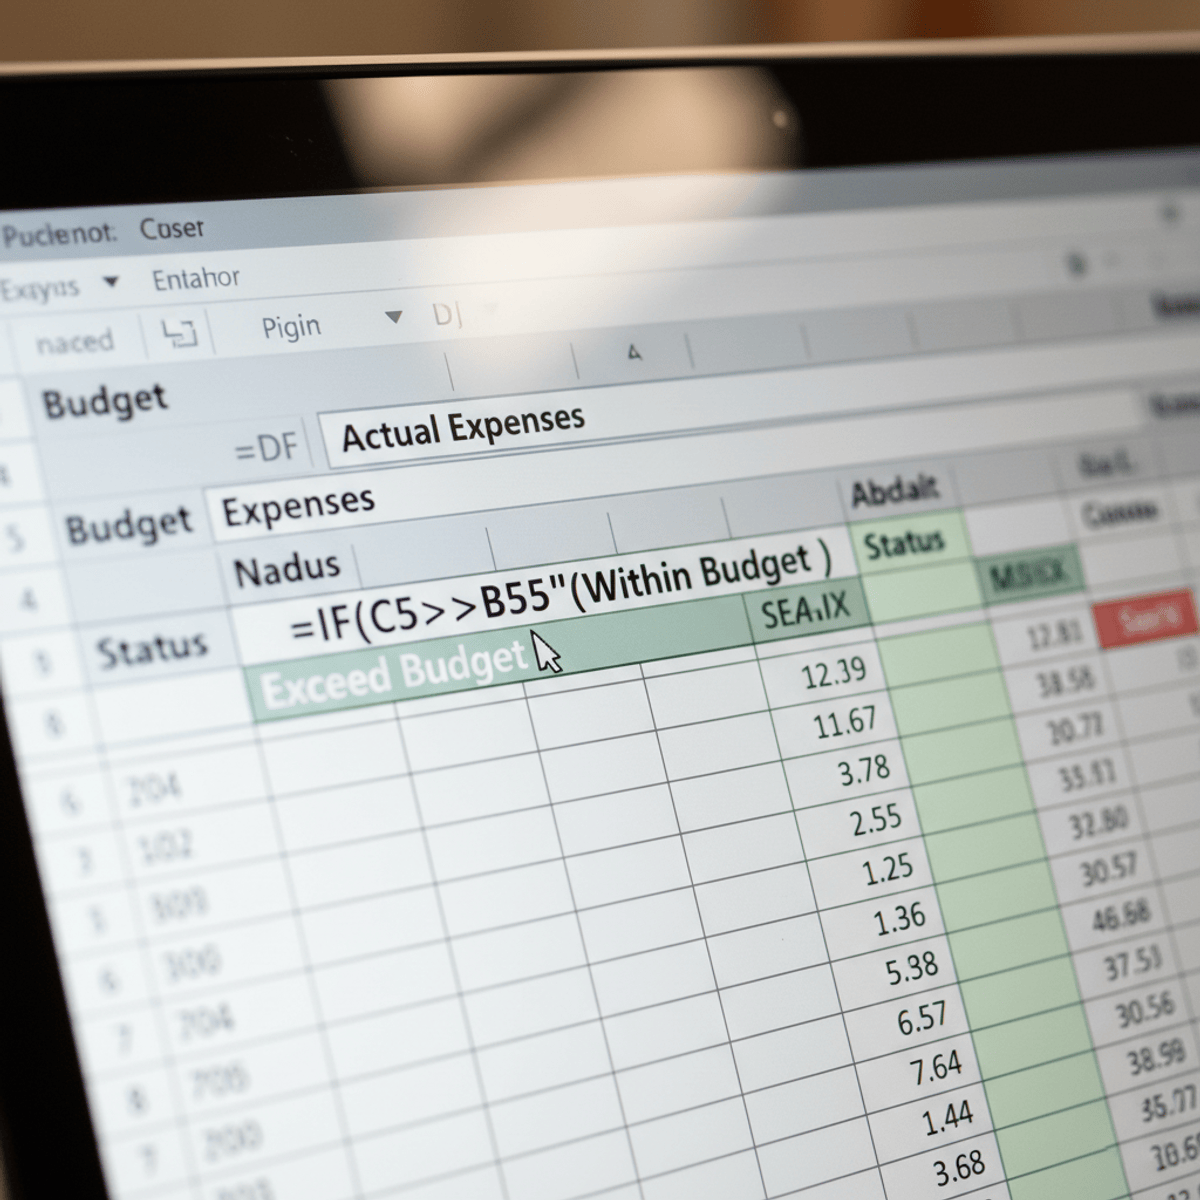
In this lesson, we will provide a practical example of how trend analysis can be used to uncover patterns in a company’s data.
👉Trend Analysis document Before: https://www.dropbox.com/s/45f6ewxk0r2wyqh/1.%20Trend%20analysis_before.xlsx?dl=0
👉Trend Analysis document After: https://www.dropbox.com/s/5e25v4124tqeiw5/1.%20Trend%20analysis_after.xlsx?dl=0
To make this exercise as close to real-life as possible, we will use some Excel formulas, so we will have to assume some pre-existing Excel knowledge. However, if you feel that you’re unable to follow along, please consider going through our Excel lessons.
Overall, what we can see from the chart is that Revenue and Cogs didn’t increase proportionally. One can probably conclude that Cogs for this business have a prevalently fixed component, and some additional analysis would be needed to understand the reason for that.
But at first glance, we can say that this is a business that can benefit greatly from economies of scale and higher revenues.
► Consider hitting the SUBSCRIBE button if you LIKE the content: https://www.youtube.com/c/365DataScience?sub_confirmation=1
► VISIT our website: https://bit.ly/365ds
🤝 Connect with us LinkedIn: https://www.linkedin.com/company/365datascience/
365 Data Science is an online educational career website that offers the incredible opportunity to find your way into the data science world no matter your previous knowledge and experience. We have prepared numerous courses that suit the needs of aspiring BI analysts, Data analysts and Data scientists.
We at 365 Data Science are committed educators who believe that curiosity should not be hindered by inability to access good learning resources. This is why we focus all our efforts on creating high-quality educational content which anyone can access online.
Check
Watch on YouTube ↗
(saves to browser)
Sign in to unlock AI tutor explanation · ⚡30
Playlist
Uploads from 365 Data Science · 365 Data Science · 0 of 60
← Previous
Next →
1
 2
2
 3
3
 4
4
 5
5
 6
6
 7
7
 8
8
 9
9
 10
10
 11
11
 12
12
 13
13
![INDEX and MATCH application of the two functions separately and combined [Advanced Excel]](https://i.ytimg.com/vi/9vrIFfMdYng/mqdefault.jpg) 14
14
![INDIRECT Excel Function: How it works and when to use it [Advanced Excel]](https://i.ytimg.com/vi/kDkS8rNCoBM/mqdefault.jpg) 15
15
![VLOOKUP and MATCH another useful functions combination [Advanced Excel]](https://i.ytimg.com/vi/2435x9FV6qY/mqdefault.jpg) 16
16
![VLOOKUP COLUMN and ROW - Handle large data tables with ease [Advanced Excel]](https://i.ytimg.com/vi/ToUaAqevy9E/mqdefault.jpg) 17
17
![The ELIF keyword [Python Fundamentals]](https://i.ytimg.com/vi/h3Vi9mtw2Jo/mqdefault.jpg) 18
18
 19
19
 20
20
 21
21
 22
22
 23
23
 24
24
 25
25
 26
26
 27
27
 28
28
 29
29
 30
30
 31
31
 32
32
 33
33
 34
34
 35
35
 36
36
 37
37
 38
38
 39
39
 40
40
 41
41
 42
42
 43
43
 44
44
 45
45
 46
46
 47
47
 48
48
 49
49
 50
50
 51
51
 52
52
 53
53
 54
54
 55
55
 56
56
 57
57
 58
58
 59
59
 60
60

Population vs Sample
365 Data Science
Data Science & Statistics: Levels of measurement
365 Data Science
Statistics Tutorials: Mean, median and mode
365 Data Science
Skewness
365 Data Science
What is a distribution?
365 Data Science
The Normal Distribution
365 Data Science
Central limit theorem
365 Data Science
Student's T Distribution
365 Data Science
Type I error vs Type II error
365 Data Science
Hypothesis testing. Null vs alternative
365 Data Science
The linear regression model
365 Data Science
Simple linear regression model. Geometrical representation
365 Data Science
INDEX and MATCH application of the two functions separately and combined [Advanced Excel]
365 Data Science
INDIRECT Excel Function: How it works and when to use it [Advanced Excel]
365 Data Science
VLOOKUP and MATCH another useful functions combination [Advanced Excel]
365 Data Science
VLOOKUP COLUMN and ROW - Handle large data tables with ease [Advanced Excel]
365 Data Science
The ELIF keyword [Python Fundamentals]
365 Data Science
Working with Tuples in Python
365 Data Science
Database Terminology - A Beginners Guide
365 Data Science
Relational Database Essentials
365 Data Science
Database vs Spreadsheet - Advantages and Disadvantages
365 Data Science
Conditional Statements and Loops
365 Data Science
Backpropagation – The Math Behind Optimization
365 Data Science
Monte Carlo: Forecasting Stock Prices Part I
365 Data Science
Monte Carlo: Forecasting Stock Prices Part II
365 Data Science
Monte Carlo: Forecasting Stock Prices Part III
365 Data Science
365 Data Science Online Program
365 Data Science
Data frames - Creating a data frame
365 Data Science
Data Science & Statistics: Slicing a matrix in R
365 Data Science
Data frames in R - Exporting data in R
365 Data Science
Data frames in R - Transforming data PART II
365 Data Science
Data Frames in R - Subsetting a data frame
365 Data Science
Data Science & Statistics: Matrix arithmetic in R
365 Data Science
Data Science & Statistics: Indexing an element from a matrix
365 Data Science
Data Frames in R - Extending a data frame
365 Data Science
Data Science & Statistics: Creating a matrix in R FASTER
365 Data Science
Data Science & Statistics: Creating a Matrix in R
365 Data Science
Data frames - Importing data in R
365 Data Science
Data frames in R - Getting a sense of your data
365 Data Science
Data frames in R - Transforming data PART I
365 Data Science
Data frames in R - Import a CSV in R
365 Data Science
Data Science & Statistics: Matrix operations in R
365 Data Science
Data Science & Statistics: Matrix recycling in R
365 Data Science
Tableau vs Excel: When to use Tableau and when to use Excel
365 Data Science
Download Tableau: Learn how to download Tableau Public
365 Data Science
Connecting data sources: Useful tips when connecting data sources to Tableau
365 Data Science
The Tableau interface: See how to navigate through the Tableau interface
365 Data Science
Tableau data visualization: Create your first Tableau visualization!
365 Data Science
Duplicating sheets: This is how to duplicate a sheet in Tableau
365 Data Science
Build a table in Tableau: The steps needed to create a simple table in Tableau
365 Data Science
Custom fields in Tableau: Using Tableau operators to create custom fields
365 Data Science
Custom fields in Tableau: Add calculations to tables through custom fields
365 Data Science
Totals in Tableau: Learn how to display subtotals and totals in Tableau
365 Data Science
Gross Margin calculation in Tableau
365 Data Science
What is a filter in Tableau: Set up a filter in Tableau to specify the data you want to show
365 Data Science
Joins in Tableau: Inner, outer, left, or a right join in Tableau
365 Data Science
Building a Tableau dashboard: Three types of charts you want to have in a Tableau dashboard
365 Data Science
Creating great looking charts in Tableau: Real life Exercise on charts in Tableau
365 Data Science
Joins in Tableau: Choose the correct join type
365 Data Science
How to make a data check in Tableau: A quick data check is better than no data check
365 Data Science
More on: Excel & Spreadsheets
View skill →


Related Reads
📰
📰
📰
📰
The Data Scientist Role Isn’t Dead. But the Old Version of It Is.
Medium · Machine Learning
The Data Scientist Role Isn’t Dead. But the Old Version of It Is.
Medium · Data Science
Boosting Startups with Data Science: A Practical Guide to Data-Driven Growth
Medium · Startup
One Lake, Five Patterns: Rethinking the Enterprise Data Foundation
Medium · Data Science
🎓
Tutor Explanation