
Advanced Data Analysis & Visualization with Copilot in Excel
Key Takeaways
Explores advanced data analysis and visualization using Excel Copilot
Original Description
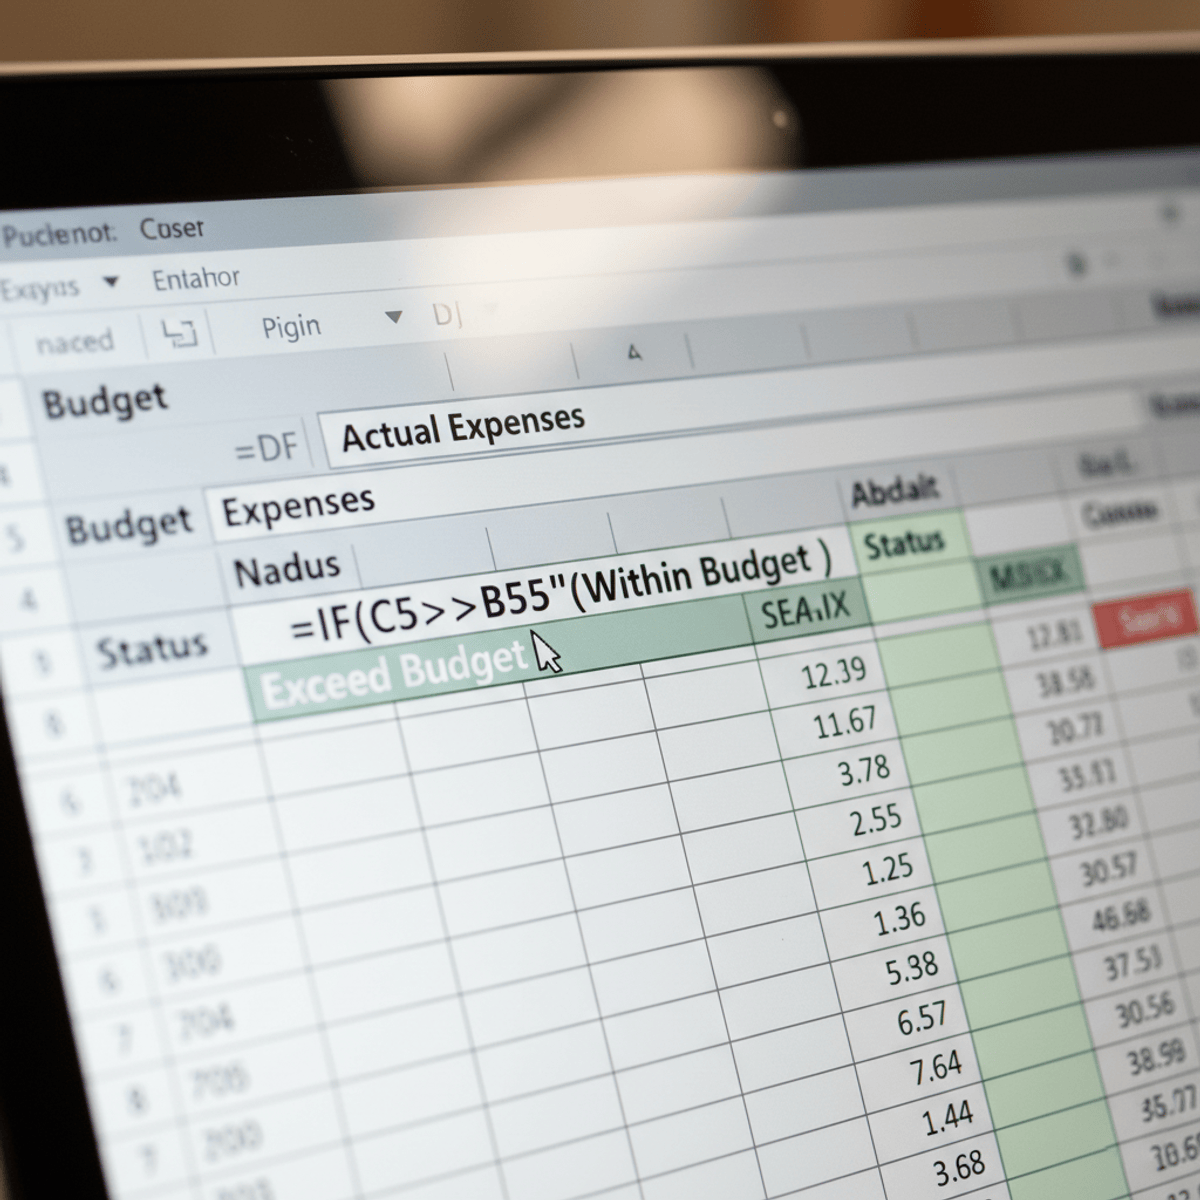
This course builds on foundational skills, focusing on advanced data exploration, analysis, and visualization using Excel Copilot. Learners will leverage Copilot to conduct in-depth data analysis, integrate external data sources, and uncover meaningful insights through advanced formulas, conditional formatting, and PivotCharts. By the end of this course, learners will be able to generate comprehensive reports with visualizations, including PivotCharts, to summarize complex data trends and patterns. They will also develop and optimize prompts to streamline their data analysis workflow, enabling them to transform raw data into actionable insights.
By the end of the course, you’ll be able to:
- Perform comprehensive data analysis and integrate external data sources using Excel Copilot.
- Apply advanced formulas, conditional formatting, and data visualization techniques, including PivotCharts, to uncover key insights.
- Develop and optimize Copilot prompts to streamline data analysis workflows.
- Create detailed reports that summarize findings and visualizations for effective data-driven decision-making.
Tools you’ll use:
- Microsoft Excel
- Copilot in Excel
Required Course Materials: A Copilot license is required to complete this course. If you don’t have a Microsoft 365 Personal or Family license, you can start a free 30-day trial using the link provided in the course.
Watch on External: Coursera ↗
(saves to browser)
Sign in to unlock AI tutor explanation · ⚡30
More on: Excel & Spreadsheets
View skill →








Related Reads
📰
📰
📰
📰
Verifying How IAM and Lake Formation Behave for the Glue REST Catalog and S3 Tables
Dev.to · Aki
We Leaked PII in Staging: Here's the Automated Data Masking Pipeline That Saved Us
Hackernoon
Why Synthetic Healthcare Data Isn’t Enough for Commercial Analytics
Medium · Data Science
Why Synthetic Healthcare Data Isn’t Enough for Commercial Analytics
Medium · Python
🎓
Tutor Explanation

 DeepCamp AI