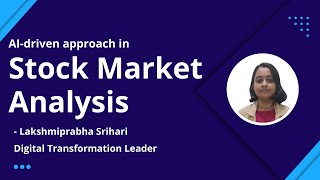
Stock Market Analysis - AI driven approach
Key Takeaways
The video demonstrates an AI-driven approach to stock market analysis, covering fundamental analysis and technical indicators, with tools such as machine learning algorithms and data visualization libraries like Pandas, NumPy, and Matplotlib.
Full Transcript
foreign playing the role of a digital transformation leader in data science team so today we will be discussing about artificial intelligence approaches in stock market analysis artificial intelligence or AI in short in fintech then a i in particularly stock market analysis then AI in stock prediction next technical analysis then fundamental analysis finally combining both Technical and fundamental analysis and how AI helps and both so what is AI artificial intelligence I think this group does not need any introduction about artificial intelligence or data science um let me ask you how many of you know about data science um you can write hands or message quickly chat okay anything from chat yeah I see okay I see some pressures as well all right if you are a fresher then analytics Vidya is a good platform to start data science your journey in data science so in brief artificial intelligence or AI is beyond your human brain using your human brain to reduce human efforts AI comes in many forms from simple automation to complex machine learning algorithms or it is using it covers a wide range of topics like statistics data science machine learning algorithms optimistical approaches operation research and so on so if you want to learn and know more about data fine you can join in analytics with you and coming to fintech if you have already transferred money to someone using an app or if you have already downloaded your statement online bank statement online then already you are a part of a multi-billion industry that is called fintech fintech means financial technology it seems simple right but it covers a wide range of topics businesses and Technologies it can include everything from cashless payments to crowdfunding to Virtual currencies to Robo advisors and so on and this is just the beginning there are a lot of things to be covered in fintech even big companies are going big on it think about Amazon pay or alipay or Apple pay right but there are a lot of risks Associated as well like data compromise data compliance data privacy and so on even then for the companies and consumers here this is not just a buzzword it is more than that and it's a big business opportunity all right so how AI helps in financial sector it is often used to perform venial tasks that a business would otherwise need to pay a worker to do AI will power 95 percent of all customer interactions in the next decade this has been predicted in many Financial articles and literatures and artificial intelligence could increase the probability of all industry by an average of 39 percent by 2035. so some of the applications of AI in fintech number one stronger security so as I said there are this associated with fintech like data privacy being password getting hacked and many things are there we can use AI so AI in cyber security today comes in the form of chatbots and enhancing human workers through automation number three improve customer service through chat Bots number four client risk profiling earlier people used to do manually analysts used to do manually the client profile rating from low to high but nowadays classification models are trained with the previous data to rate the client profile from low to high under lot of time savings then user Behavior Analysis that comes to Broad detection as well and then algorithmic trading so these are some of the applications I have mentioned some of the most important applications of AI in fintech but there are a lot more all right narrowing down to AI in stock market analysis first some applications AI reduces research time for finding stocks for example in order to find out or figure out which stock to invest in that itself will take a lot of time approaching broker approaching many research many companies documents right but using AI analytics you can crunch all types of data from different sources within seconds and this helped stock market especially in India uh people have logged logged in demat a lot so the number of dmat accounts in India jumped to 63 percent in financial year 2021 to 2022. so this this has been published on 15th April 2022 and even it reached to at least 80 percent in this financial year AI helps automate the sale and purchase of stocks and AI also helps reduce the overall cost of trading and finally last but not the least AI helps in prediction this is the most crucial part and today we will be focusing on this prediction is an integral part of the stock market in general and stock trading inspective there are two types of analysis fundamental analysis and technical analysis when coming to stock market analysis in fundamental analysis an investor looks into company's growth profit and loss statement news channels interviews and many things whereas in technical analysis an understood looks into the historical data notices patterns uses many statistical models and machine learning algorithms to predict the future people generally split into groups and debate that one analysis is always better than the other but AI helps to combine these both fundamental and technical analysis in one place what is more AI can help you perform news uh sentiment analysis blogs and interviews to understand and predict how the stock will perform in a more accurate manner and this improves the overall chances of you making the right prediction okay with that all introduction let me quickly ask how many of you know some basics of quintech here about stock market analysis in particular maybe you can write fans okay seems good all right um thanks for your response um so um we will be discussing a lot about machine learning models and data science algorithms or statistical models uh maybe uh whoever is very new to this uh who have not heard about these models um can check into it later after this session and you can again look back into the video all right so let us go to the first part technical analysis uh in um stock market analysis uh that deals with predicting the prices using statistical models or machine learning models for illustration we will be dealing with Hands-On index today which is Hong Kong's handsome index all right so what is a stock market index a stock market index or just an index is a number that measures the relative value of a group of stocks it is maybe a better average of all lit components Suppose there is an index and there are 500 components in it and an index represents a weighted average of all its components all its 500 components sometimes it may be a weighted average and in case of some other index it may be a different uh mathematical formula or a statistical measure it depends uh from stock to stock but in general it helps to track the performance of a group of stocks as the stocks in this group change value the index also changes value for example the standard and Poor's Index um that is s p 500 in short has uh it represents a group of 500 stocks U.S stock uh associated with that if an index goes up by one person then that means the total value of the Securities which make up the index have gone up by one percent in value so these are the components of Hong Kong thanks and index and totally it has around 30 components and I have started from 0 because in order to use Python Python's first index is zero so you can feel free to make it one but for python I have started from 0 to 29 so there are 30 components of hang some index and I will tell you the approaches to how to deal with and how to predict the index as well as the components all right so when talking about prediction or any machine learning problem you should not directly jump into prediction at first place before that there are a lot of things to be done first is exploratory data analysis or in short Eda in case of stock market analysis the second step is to predict the trend trend is nothing but whether a stock increases or decreases it represents the increase or decrease of a stock for a period number three find out the most influential stocks for a particular index for example we are considering Hong Kong hands and index or maybe you can consider BSE and then you see which are all the stocks which are influencing a particular stock maybe you can consider an I.T stock and then you find out the most influential stocks but these are all using AI okay so let us start from Eda or exploratory data analysis I shall quickly share this dashboard or an app which I have built for and you have data Science Academy so let me quickly share you the app and so the dashboard is getting load up um allow me one second so this is a dashboard which I have built for new app data science academy and basically this is a world stock market index dashboard and which deals about all the edas exploratory data analysis for various indices like it is from USA Global indices Asia Pacific indices and Europe and the topic of Interest was to find out what happened after U.S president Trump's win that was the topic of Interest why I chose this one because it was there was all a new spread and there was a lot of wealth that stock market crashed during and after U.S president Trump's then so that's why uh I chose this experiment and this is a kind of Crisis this was believed to be a kind of Crisis similarly you can take any uh crisis period like covert maybe or a pandemic or an economic crisis in 2009 in U.S so anything so coming here if you can navigate through the tabs um so quickly I shall move to Hong Kong Hong Kong's Hampton index and so this has all the index right from Asia China and everything is this has so let me choose this because Australia Indonesia and everything India's everything you have so this this completely represents the exploratory data analysis of this and there is a Blog I have written for the same Academy and you can have a look at it so so this is how you have to uh do exploratory data analysis plotting various kinds of charts so the x-axis represents the dates and the y-axis represents prices closing values and not just line charts you can just play around with candlestick charts which is also an important chart for stock market analysis and then area chart bar charts and then dots so these are all just various forms of analysis and representation to dive deeper into the analysis so let us stick to this line chart and you can see on x-axis dates and y-axis closing prices and the period selected was from uh Jan 2016 till Jan 2018 so this represents the overall period but if we see this this is just an overview this is just birds eye view so we have to dive further deeper into it and split the period so what I did I'll split the P at entire period into 3 the first one is before U.S president Trump's been or before that election time so that is Jan 2016 or uh Jan 2016 to October 2016 and the next one is crucial moment that is the exact presidential election time from October 2016 till December 2016 and finally after U.S president Trump came to throne what happened from Jan 2017 to Jan 2018. so if you see here right you can see uh the chart and so what is the next step what ideas do you get from this analysis before uh let I explain detail I would like to know some comments from you right stationary Check Yes yes how will you know some index performed well Rising Trends right stocks crashed at a critical moment good yes you can go for Deca Fuller's test for finding stationary or not right growth rate indication right all right so quite good answers so in order to deal with such donations let me go back to the slides so in order to perform these kind of analysis you should know about time frame right so what is Time series any data represented with respect to date is a Time series data and I'm not going to go much deeper into time series because that itself is an one hour session but in brief let me explain so you see two boxes here right these are two examples and the first layer represents the data and every time Series has three components so the second layer represents seasonality what is seasonality its seasonality is a repeating pattern over a period of time for example consider an ice cream business we will know that the business will be always higher in someone than in Winter and this pattern repeats for every year right so this kind of repeating pattern getting captured in the time series data is called seasonality component then the third layer represents Trend so what is Trend as I said before it is just an overall increase or decrease for a period of time and in the first box right in the first example there is not much Trend whereas in the second box you can see that it is decreasing right it has a decreasing Trend all right and the final layer is nothing but irregular component which captures the all the remaining Left Behind part right so any every answer is has all these components and the important point to be noted is whenever you see seasonality before prediction you have to remove seasonality out of it from the data all right and there are two kinds of time period one is stationary versus non-stationary so stationary time series is one whose statistical property such as mean median variance all will be constant over time or in layman terms it will have a pattern or a fixed pattern like normal distribution or uniform distribution something whereas an in non-stationary Time series data there will be no such pattern it will be all random and it will often drift with respect to time so what happens its prediction is like shooting a moving Target we will generally say a random walk to represent non-stationary behavior of stock market in finance uh most of the stock market data are non-stationary and that makes their prediction nearly impossible it is very hard to shoot a moving Target right that's what it happened but whenever you see a non-stationary series the first step is you have to convert that into stationary using some uh formula similarly and also to remove these analogy so these are the two points to be kept in mind before proceeding and this is a nice book uh you can have a look at it uh whoever interested in more in finance all right so now coming back to to the example uh the unique period or crucial moment let me share back again so here you can see that before presidential election right period before when it was the trend of increasing but uh there are a lot of ups and downs right this is not stable at all of course this is all non-stationary coming to crucial moment yes the stock market it didn't crash completely but it was decreasing for three months during the uh election time and during uh Trump's win uh there was all some disturbances and some have over so it started to decrease but then after you see that when he came to throne it started to increase the trend had been increasing and what is interesting is it reached an historical highest value that is the interesting thing here and there was a gossip or a belief that the stock market completely crashed but no it was just for three months there were some disturbances but then it started to increase like anything and it and it has been a historical increase rise in the value so these things uh you have to observe from your data as well whenever whichever data you want to choose whichever stock your interest you have to observe these analysis and uh you have to come out with your all right so coming back to slides all right so we have completed exploratory data analysis and what are the questions how to train the models to extract its best for hands and components as we are considering Hansen index so how to train the model second which stocks will influence the movement of a particular stock right and this boils down to how to predict the trend of major components of Einstein index and so the problem was framed as a two class classification problem uh this may be a very very new to some of the people here but so there are in data science especially in supervised learning there are two kinds of algorithms like regression and classification and here this problem is represented as a classification problem and there are two classes it's zero and one if you feel difficulty here you can always check with analytics with your other lectures and then come back here for this application all right um so this one and zero uh there are two classes so one represents whether a staff will increase or not and uh zero represents uh whether the stock will not increase so one represents increase and zero represents not increase and the experimental period was 11th March 2013 to 8th March 28th so before moving on to the model part uh I would like to discuss about performance evaluation metric and there are a lot of evaluation metrics uh for classification problem especially the simplest one is accuracy accuracy is the percentage of correctly classified samples and the standard one is are was the AUC before uh it is nothing but the area under the curve plotted between the two positives and false positives and higher this course better the performance of model for both these Sports and there are a lot of other metrics available and people are very much interested in f-score uh precision and recall but that was not necessary for me because the data was quite well balanced it is not imbalanced so balance and imbalance means that it is it is equally balanced like there are no such classes one higher than class was Zero it is not so this may be a little bit difficult to understand but you will get to all right so coming to this experimental setup um I shall quickly show you the code so uh there is a git page available and I have pushed all the calls related codes to here and there is a Blog also you can go and check it uh look at it here any tag and so you can see the data and all the codes available here first let me walk you through the data so coming to data so these are the 30 components of ranks and index which I showed you before and then what you can see is some of the world's major indices like Dow Jones some of the European indexes and then Mexico uh Indonesia Jakarta and NASDAQ of course Nifty NYSE Tokyo's Nikkei and so on and so forth right so you have to consider all these major indices as well as all the 30 components as well um so that you will find out the most influential stocks we we will never know without analysis that which stocks May influence another stock for example uh you may be interested in an I.T stock but and another oil and gas industry Stock May influence this one or Advanced stock my influence is it stock we will never know so these experiments we have to conduct every time and find out which stocks will influence the other stock so that's why we have to consider a lot of teachers so let me show you the data here so the First Column is the date it starts from March 2013 so the First Column is the date and this data is a Time series data it is associated with it so we have a five columns right uh open high low close and the volume uh let us now talk about adjacent growth for now but uh we have four columns or five columns so first what does open column represents open represents the opening value of a stock that means the very first value for the day whenever the market is opened uh for example in India it opens at 9 15 am but it the time is not important because it varies from country to Country and also we are considering all the global indices so the open by opening stock represents the very first value of the stock and high represents the highest value it reached for that day and low represents the lowest value it reached for that day close represent the last value the final value for that day whenever a stock market closes at 3 30 PM or 3 pm but it differs from country to Country it represents the final value for the day and one more thing low and close or not fail because the market may have reached low even at afternoon or sometime at 1 pm so low represents the lowest value it reached for the day and close represents the final value for the day adjacent close is not important because it just represents a percentage more one percentage or two percentage modification of close maybe some average of all these values or uh some percentage added due to company's performance but we can stick to close for our analysis and finally volume volume represents the number of stocks traded for that day so you can see here complete data from 2013 to 2018 all right and as I said these are all times there is because every one of them is associated with time and open is a transfer is high if the time series lows the time series and closes at answers in general uh people will represent this as ohlp values so all of these are time series and as I said before two points to be noted one is if the data is non-stationary we have to convert it into stationary before going on to production and the second step is if there is seasonality then the seasonality has to be removed from the series all right so going back to slides so these are the features for the model uh volume Trader and percentage change of ohlc for each of the 30 components thanks and index of course that's what we are predicting some of the major indices like a NASDAQ or NYSC or um NSC BSC and some of the major currencies like Euro USD or even INR anything and so when you are predicting for Monday suppose you want to predict uh the stock movement for Monday then you have to consider Friday's data right that is what historical data means so you want to predict for Monday and you are considering Friday's data that is October 14th data 15th and 16 being holidays 14 data but it is not just October 14 that is one day's data you may have to consider 13 12 October 12 11 and many things like it depends on the model so you have to do experiments and find out that whether you have to consider only one day's data or five days data and so on so I'm not talking about the training data complete data it is it should be many years it should be for at least three to five years but I'm talking about taking the prior days data even as the column that's what I am meaning so I'm not talking about the rows I am talking about the columns so in my experiment I considered that even one day or five days data would be better so if you consider for one day each of these open high low close values of all the 30 components and the index and major indices then the number of teachers were 310 if you increase it to 5 days then it was 1060. and if you increase it more to 10 days then the number of predictors were 18 10. so like this it went on and on and then I found out that we can stick to one day or five days after Computing the conducting the experiments and Computing the accuracies and there will be some missing values why because in holidays in India need not be a holiday for U.S another country for example an Independence Day August 15th need not be a holiday for you as in other countries so what we have to do we have to fill in and impute the missing values the better guess would be to use forward fill that means you assume that for that day we can't fill it up with the previous day's values for example if today is a holiday so you can say that okay I shall fill it up with the proteins values here all the overhealthy values or sometimes in some places you can use zero but if you use a lot of zeros then the Matrix will be parse the Matrix will become a sparse Matrix so better we can stick to forward fill or initial experiment and then you can go ahead with more mathematical formula or some statistical measure for that but forward fill is the best wild guess at last Target what you are about to predict one or zero so how will you define in training set Target will be one if percentage change in close will be greater than 0.5 or else it is 0 right so you can go and check these this block where I have uh detailed about all these experiments and features okay at last the results so I have tried a lot of classifiers and the code is available in GitHub I will show you in short so uh there are a lot of models even available in literature as well like logic regression support Vector machines random porous gradient boosting xgb and even neural networks which is an advanced topic of artificial intelligence so there are a lot of models available so you can go and look into literature and start learning about them in literature for this analysis uh predicting the movement of stock market analysis uh people were able to achieve only till 68 percent and that was the best accuracy available in literature if you consider all the components of the index if you are predicting for index then 58 percent accuracy is the best yes of course it is not a higher accuracy but that is the maximum week would reach with all of the components because we have all the features but if you focus only for two or three of the components like for example AAC Technologies or some oil and gas company then you may you should be able to achieve more than 95 percent or at least 90 percent all right so coming back to this analysis so logistic regression was just giving 59 percent whereas support Vector machines and gradient boosting reached till 67 percent and random Forest also stayed at 63 percent okay next step so I see how to know that our model is working well or now um so you it is it is based on accuracy only so you will know about the metrics I showed like always the AUC and accuracy yes of course 0 is not preferred you can use mean or forward fill is the better better guess mean can be used but if there are outliers then mean will lead into um a bad value so forward fill is better yes so how can we combine the external factors uh I will come to that in part two in a short time Sanjay so how does the stock influence another stock I will also explain that at the end of this experiment so confusion Matrix is used to compute Precision recall and F1 score uh only if the data is not at all balanced uh here the data was very well balanced even in stock market the data will be always balanced and it is non-stationary so these are you know the standard nature of uh stock market data all right so I think we have covered most of the questions here so let me go back to the next step how to improve accuracy obviously the first step is to increase the training data so I was using three years before now I am going to use four years of data and then test for just one year so this this is obviously necessary in order to avoid overfitting or under fitting or uh not just the model to learn a lot it is just under learning or it is not learned well so in that case you have to increase the training data you can use more latest data or you can use some of the history if you are considering this pandemic you cannot use much 2020 data or 2021's data if you are about to predict for this year you cannot use the pandemic data because it will be all messy and some of the missing and lots of ups and downs so then you have to rely on the historical data like 2018 1920 or even you can start from 2015 so you have to rely on that so based on experiments only you will come to know that which which one to be preferred but if the data in the if the period is good then you can rely on the latest data then the last 10 years back data or 5 years back later one of the observations you can use so increasing the training data is the first step to improve accuracy but you can see uh the model shows just one person increase especially logistic regression and random forest from 59 to 60 and 53 to 64 and SVC and gradient boosting remain the same and it is a good news because the models were not overfitting you see that here right so these terminologies may be very new for some people but it you you will get to know about it so SVG and gradient boosting or they they remain stable they perform stable and they were not overfitting and the next step is to do some feature engineering so I already showed you that there were at least 300 features for this model right even if if it is a simpler model it has to be at least 300 features so in order to reduce the features what you can do first you train with some tree based models like random forest or gradient boosting or even xgb then you extract the top 20 features using shap analysis and finally we train the remaining model with these features so we are reducing from 300 features to 20 features and these are the best features which model gives us all right so with that you can see logistic regression improved from 60 percent to 66 percent it is a huge improve Improvement and as we see it Remains the Same it shows that it is not over fitting at all so if you say a stable accuracy then the model is not over fitting or underfitting it is performing well and uh you you it is it is a plateau here you can't go above that and that has to be accepted and that is the best model is showing so these are some of the observations here so at last the final observations and recap so we did first exploratory data analysis and we have seen that different machine learning algorithms will perform differently on different stock markets number three the model which gets trained in smooth period and predicts well in short period can be productionized like it can be used for further future predictions for example if you are able to train the model before pandemic and if it is able to predict even during pandemic then it is it is obviously a better model but this is not the price prediction it is just predicting the trend we are just doing initial analysis only and it is very essential in the case of stock market so we are in the initial stage and this itself is a huge experiment which you have to do all right so the third Point coming to Third point the start movement of a particular star is not just dependent on its own over Chelsea values but also on other stocks so I shall show you an example here okay so now you can see this code um so I shall walk you through from the beginning um so this is just importing features and all and this is the data I'm inputting data and so you can see I I'm representing uh open high low close that is over Chelsea values uh for the first component that is zero because python uh Python's first index is zero number one represents second component and so on and so forth so these are the 30 components of uh the Hampton index and we are further adding other indices as well right uh like major currencies as well so totally there should be 58 components and the 310 features and I showed you that um for one stock some other stock will be influencing it right for example so Target 0 represents the very first component right AAC Technologies and it is influenced by when you look at the best features from after you train the model and you extract the features you can see a lot of variations here of course you should see its own overhead healthy values that is for the stock 0 its own close its own high its own low should be there that should be also influencing but other than that you can see volume 58 is influencing that means the 58th stock was influencing the first stock 15 open 15 low 48 close 44 Volume 4 that means the volume of the fifth staff was influencing the first start right High 43 close 56 so see how many variations are here for even the first talk right so let me go back to do you remember this zero 15 58 60 31 4 right so we shall go back to that slides and see the components okay so here we are and so this is the first component and for AAC Technologies we saw four was influencing that is China some Dairy company see some Dairy company was influencing a Technology stock and if we go back to 14 it was number 14 right so we should look at 15. so some development company right so on and so forth on China mobile limiter yeah so for first half many other uh stocks were influencing this Technology stock right and then 58 and all represents some of the major currencies and some of the major components right so similar way you have to analyze each and every stock and find out which stock which other stocks or influencing the particular stock okay so getting back to the observations all right so as a final takeaway home message is for a Trader or an investor to watch all the prizes of its own stock uh for example AAC Technologies but also the other uh staffs which which are influencing that stuff like maybe an Owen or oil and gas or maybe some mobile company or maybe some other bank anything and you will get no get to know about it from these experiments all right so now we are done with the technical analysis we are ready with the top 20 features uh after analyzing the trend and after doing a lot of experiments we are ready with some of the top features and most influential stocks we will know now coming to the external factors or the fundamental analysis so you will know you will know about these external factors from fundamental analysis and I'm going to tell you the AI approaches in fundamental analysis right so fundamental stock analysis what is it companies create plenty of financial documents right like earnings per release quarterly financial report like 10 Q or 10K income statement balance sheet statement of cash flows these are very less I am mentioning here but these are the most important documents you have to have a look at so quarterly statement will be available every quarter an annual report will be available every year so on and so forth right so you have to look at it at regular intervals maybe every month or maybe uh every week we will never know and these are all coming in forms of computer or maybe an images a scanned PDF or maybe a company web page like a form of text and this is all unstructured data and how will you do all these how will you look at all these manually it is it is a lot of manual efforts right that is where AI comes to help so we have to convert this unstructured data to structured ones structured table with the help of AI to reduce manual efforts so how does AI help to extract information from financial report within few seconds automatically without any manual efforts so what I'm going to tell you is using AI how you can extract the ratios some of the financial ratios which are also very important to be considered for stock market prediction so prediction is our final aim and already we have completed our first analysis technical analysis as a second step we are going to extract ratios which will influence the prediction and using AI so when you pass in the PDF like uh financial statement like um 10K or 10q you will extract these information within a fraction of seconds it is just maybe five again for a 500 pages period and five seconds for even thousand pages of PDF it's all with respect to AI so you will extract interest coverage ratio total net leverage ratio current ratio quick ratio there are many solvent ratios liquidity ratios many things so you will extract the ratio it's time its values like 3.75 to 1 and total leverage ratio should be this and this and it should be five to one between this period and so on and so forth so you extract with ease using AI all these information right this is a kind of automation step um so the problem is to convert PDF or image to text and then you will have a whole lot of paragraph right in a PDF you will see a lot of paragraphs a lot of tables using AI you split the paragraphs you split the entire text into paragraph and identify the right paragraph whether it should be the interest Ratio or net coverage ratio anything you find out that and using any R you get the names stock names time what are the values Etc you get them and finally get it in the form of table so this is a flowchart for that and you can follow these techniques uh to extract those uh information uh financial ratios or something and I'm not giving the code here and because these are all advanced uh Ai and language based models NLP techniques especially so you will get to know about this and once you have all this information right so from technical analysis you collected some 20 best features and then from fundamental analysis you collected the information of ratios now you are ready for prediction now if you pass on all these information into that prediction model and you get the stock market prediction and what model will you be using you will be using lstm model that is it is a deep neural network and it is an advanced model and it is always recommended to use lstm model to predict the final stock prices with this we come to an end so we we discussed about the technical analysis and how to use AI to extract some important features out of it and then use uh fundamental analysis and to extract some of the important ratios financial ratios out of it and how AI helps in that finally how to combine these two technical analysis and fundamental analysis into one lstm model using for prediction okay so suppose you have this a stock of company X trades at rupees 10 and considering the market sentiment and previous data AI predicted it to touch rupees 20 by the end of year all good yeah it is completely possible but what if another pandemic hits the planet or if the CEO of the company defrost the company right some unexpected events even that cannot be predicted using sentiment analysis from use there are many Lord verbs there right sentiment analysis of news from uh even from company interview like CEOs interviews you you can do many things using text using sentiment analysis using audio video many things can be extracted but what is the probability or guarantee that will it will all go good right no the what is the final verdict we can use AI to reduce manual reports and to make smart Precision but they are also prone to errands right it is not that always it will be good these predictions will be good but we can depend on AI at least to some level with some Confidence Code right all right so any questions so I see a few questions I may go from the last can we get the link to GitHub repo I think already it has been shared um right oil prices um like change in oil cost transportation business this is one parameter can you tell other factors also um this is one parameter uh can you do over fitting which is one parameter um Sanjay this is one parameter can you tell other factors also okay so I think you were talking about you are mentioning about this fundamental analysis I think so which is Target parameter so Target is always the closing value it should be decided based on one or zero whether it will increase or not uh or not and then uh for technical analysis and coming to prediction you should always focus on your stock of Interest it is your you you have to decide which top you want to focus that is the Target and you can always choose the closing value as your target uh because either the values like open or high or low will not make any uh significance in that so you can always rely on what would be the closing value and you will get of course there's some confidence interval that you can predict or you can figure out uh these things foreign and how do you extract the 20 best features and how is this done in Python so uh you can always uh check look into the GitHub code which I have shared uh there are options and there are a lot available in sklon uh documentation as well there are a lot of things available outside so you can do using python uh to reduce features can we use PCA uh yes uh Chandra you can use PCA but the thing is um it will not be a smart guess PCA will give you any features it will just focus on it is just a vector right it will just focus on reducing the number of features but if you want to make some smart guess then it should be uh only based on three base models only xgb or GB can help you in that how can we reduce overfitting of a model so overfitting can be reduced by using more training data and some adjustments in hyper parameter tuning so those things will be helpful and okay if our model is ready then new data is added so how to work on that new data yes so you can get more more and more data as I said before you can get it from past or from future and you can add into that model so that you can adjust the model you can increase the training data all right so outliers yes you can do outliers check um um you can just plot uh some box plot or something you can check the outliers um yes but it depends on uh it depends from data to data from index to index so that code in GitHub it's only for handsome index and it is only for from 2013 to 2018 it is it is looking good but if you have if you change the data if you change their period Then it may be anything right so for that you have to again find you the model and then if you want to change the index then again you have to fine tune the model and find and you have to change the data so you can use the code and you have to change the data and you have to if necessary if required you have to you may have to change the um hyper parameters and you can conduct your experiments and uh and you can have your own observations all right so I think we are good here yeah over to you analytics video yeah thanks a lot on behalf of analytics so yeah I would like to thank you for your time and for delivering such a wonderful session I'm sure our audience found it insightful and hopefully we can conduct more such sessions with you in the future sure thank you thanks for hosting me today and uh of course my official name is I would like to uh point out here uh Lakshmi prabhasudhar Sanam you can find me in LinkedIn and sugar is my nickname yeah thank you [Music]
Original Description
Basically, there are two kinds of analysis which investors perform before investing in a stock. First is the fundamental analysis, in which the investors look at intrinsic value of stocks, performance of the industry and economy, political climate etc. to decide whether to invest or not. On the other hand, technical analysis is the evaluation of stocks by means of studying statistics generated by market activity, such as past prices and volumes. Technical analysts use stock charts to identify patterns and trends that may suggest how a stock will behave in the future.
In this DataHour, Lakshmiprabha will be discussing various ways of Digital transformation and Artificial Intelligence in both analyses, how to reduce manual efforts and make smart decisions.
🔗 More action pack session here: https://datahack.analyticsvidhya.com/contest/all/
Stay on top of your industry by interacting with us on our social channels:
Follow us on Instagram: https://www.instagram.com/analytics_vidhya/
Like us on Facebook: https://www.facebook.com/AnalyticsVidhya/
Follow us on Twitter: https://twitter.com/AnalyticsVidhya
Follow us on LinkedIn:https://www.linkedin.com/company/analytics-vidhya
Playlist
Uploads from Analytics Vidhya · Analytics Vidhya · 44 of 60
1
 2
2
 3
3
 4
4
 5
5
 6
6
 7
7
 8
8
 9
9
 10
10
 11
11
 12
12
 13
13
 14
14
 15
15
 16
16
 17
17
 18
18
 19
19
 20
20
 21
21
 22
22
 23
23
 24
24
 25
25
 26
26
 27
27
 28
28
 29
29
 30
30
 31
31
 32
32
 33
33
 34
34
 35
35
 36
36
 37
37
 38
38
 39
39
 40
40
 41
41
 42
42
 43
43
 ▶
▶
 45
45
 46
46
 47
47
 48
48
 49
49
 50
50
 51
51
 52
52
 53
53
 54
54
 55
55
 56
56
 57
57
 58
58
 59
59
 60
60

The DataHour: Data Science in Retail
Analytics Vidhya
The DataHour: Anomaly detection using NLP and Predictive Modeling
Analytics Vidhya
The DataHour: Energy Data Science Project from Scratch
Analytics Vidhya
The DataHour: Explainable AI Need and Implementation
Analytics Vidhya
The DataHour: Google Cloud AI/ML
Analytics Vidhya
Prediction to Production in Machine Learning #machinelearning #prediction
Analytics Vidhya
Practical Applications of Data science in Ecommerce
Analytics Vidhya
How to tackle Overfitting?#machinelearning #overfitting
Analytics Vidhya
Building Data Pipelines on GCP #googlecloud #datapipelines #data
Analytics Vidhya
Hands-on with A/B Testing #abtesting #datascience
Analytics Vidhya
Efficient Implementations of Transformers #transformers #cnn #machinelearning
Analytics Vidhya
Modern Deep Learning Architecture #deeplearning #architecture #deeplearningtutorial
Analytics Vidhya
Key steps for Designing Artificial Neural Network (ANN) for Image classification #machinelearning
Analytics Vidhya
5 things you should know about Azure SQL #azure #sql #datahour #datascience
Analytics Vidhya
AI & ML in the Automotive Industry #machinelearning #ai
Analytics Vidhya
Building Machine Learning Models in BigQuery
Analytics Vidhya
NLP aspects in Telecommunication Industry
Analytics Vidhya
Practical Time Series Analysis
Analytics Vidhya
Fundamentals of Quantum Computing
Analytics Vidhya
A DAY IN THE LIFE of a Data Scientist (From waking up to working on algorithms)
Analytics Vidhya
Classification Machine Learning Model from Scratch
Analytics Vidhya
Knowledge Graph Solutions using Neo4j
Analytics Vidhya
Model Guesstimation (MLOps)
Analytics Vidhya
ETL Pipelines in Google Cloud Platform
Analytics Vidhya
Key steps for Designing Convolutional Neural Network(CNN) for Image Classification
Analytics Vidhya
Getting Started with AWS EC2 #amazon #aws
Analytics Vidhya
How to Use Azure NLP and Graph Databases for Intelligent Knowledge Mining
Analytics Vidhya
Certified AI & ML BlackBelt Plus Program #shorts
Analytics Vidhya
Visualizing Data using Python #machinelearning #visualization #python
Analytics Vidhya
DCNN for Machine RUL Prediction using Time-series Data #timeseries #machinelearning #datascience
Analytics Vidhya
M in ML stands for Math & Magic
Analytics Vidhya
An Unsupervised ML approach using Clustering
Analytics Vidhya
Customizing Large Language Models GPT3 for Real-life Use Cases #gpt3 #datascience
Analytics Vidhya
Model Parameters vs Hyperparameters - Techniques in ML Engineering #machinelearning
Analytics Vidhya
Practical MLOps #mlops #datascience
Analytics Vidhya
Data Engineering with Databricks #dataengineering #databricks
Analytics Vidhya
Multi-Objective Optimisation
Analytics Vidhya
When Airflow Meets Kubernetes
Analytics Vidhya
AI in Banking
Analytics Vidhya
Learn Convolutional Neural Network for Image Recognition
Analytics Vidhya
Extracting Value from Data
Analytics Vidhya
How to measure Marketing Channel Effectiveness
Analytics Vidhya
Transforming Lives | Data Science Immersive Bootcamp
Analytics Vidhya
Stock Market Analysis - AI driven approach
Analytics Vidhya
Become a Data Engineering Professional in 2022 | Future Trends + Skills Required
Analytics Vidhya
Ensemble Techniques in Machine Learning #machinelearning #ensemble #datascience
Analytics Vidhya
The Power of Visualization | Tableau Full Course | Analytics Vidhya
Analytics Vidhya
Demand for Data Engineers is on the Rise | Data Engineer | Analytics Vidhya
Analytics Vidhya
Data Visualization in Data Science | DataHour | Analytics Vidhya
Analytics Vidhya
Role of Optimization in Machine Learning & Deep Learning | DataHour | Analytics Vidhya
Analytics Vidhya
Solving any Machine Learning Problem | Approach and Steps Involved
Analytics Vidhya
Topic Modeling Explained with Implementation | Using LDA in Python | DataHour by Arpendu Ganguly
Analytics Vidhya
Data Engineering in E-Commerce | The Best Case Study
Analytics Vidhya
Introduction to Classification using Azure Machine Learning | DataHour | Analytics Vidhya
Analytics Vidhya
Introduction to Federated Learning | DataHour | Analytics Vidhya
Analytics Vidhya
Diffusion Models for Generative Arts | DataHour | Analytics Vidhya
Analytics Vidhya
Master Google Analytics in 1 Hour | DataHour | Analytics Vidhya
Analytics Vidhya
Learn Hypothesis Testing | DataHour | Analytics Vidhya
Analytics Vidhya
A Practical Approach to Kaggle Competition | DataHour | Analytics Vidhya
Analytics Vidhya
Making AI work for Business | DataHour | Analytics Vidhya
Analytics Vidhya





🎓
Tutor Explanation

 DeepCamp AI