Intro to Predictive Analytics Using Python
"Introduction to Predictive Analytics and Advanced Predictive Analytics Using Python" is specially designed to enhance your skills in building, refining, and implementing predictive models using Python. This course serves as a comprehensive introduction to predictive analytics, beginning with the fundamentals of linear and logistic regression. These models are the cornerstone of predictive analytics, enabling you to forecast future events by learning from historical data. We cover a bit of the theory behind these models, but in particular, their application in real-world scenarios and the process of evaluating their performance to ensure accuracy and reliability. As the course progresses, we delve deeper into the realm of machine learning with a focus on decision trees and random forests. These techniques represent a more advanced aspect of supervised learning, offering powerful tools for both classification and regression tasks. Through practical examples and hands-on exercises, you'll learn how to build these models, understand their intricacies, and apply them to complex datasets to identify patterns and make predictions. Additionally, we introduce the concepts of unsupervised learning and clustering, broadening your analytics toolkit, and providing you with the skills to tackle data without predefined labels or categories. By the end of this course, you'll not only have a thorough understanding of various predictive analytics techniques, but also be capable of applying these techniques to solve real-world problems, setting the stage for continued growth and exploration in the field of data analytics.
Watch on External: Coursera ↗
(saves to browser)
Sign in to unlock AI tutor explanation · ⚡30
More on: ML for Analytics
View skill →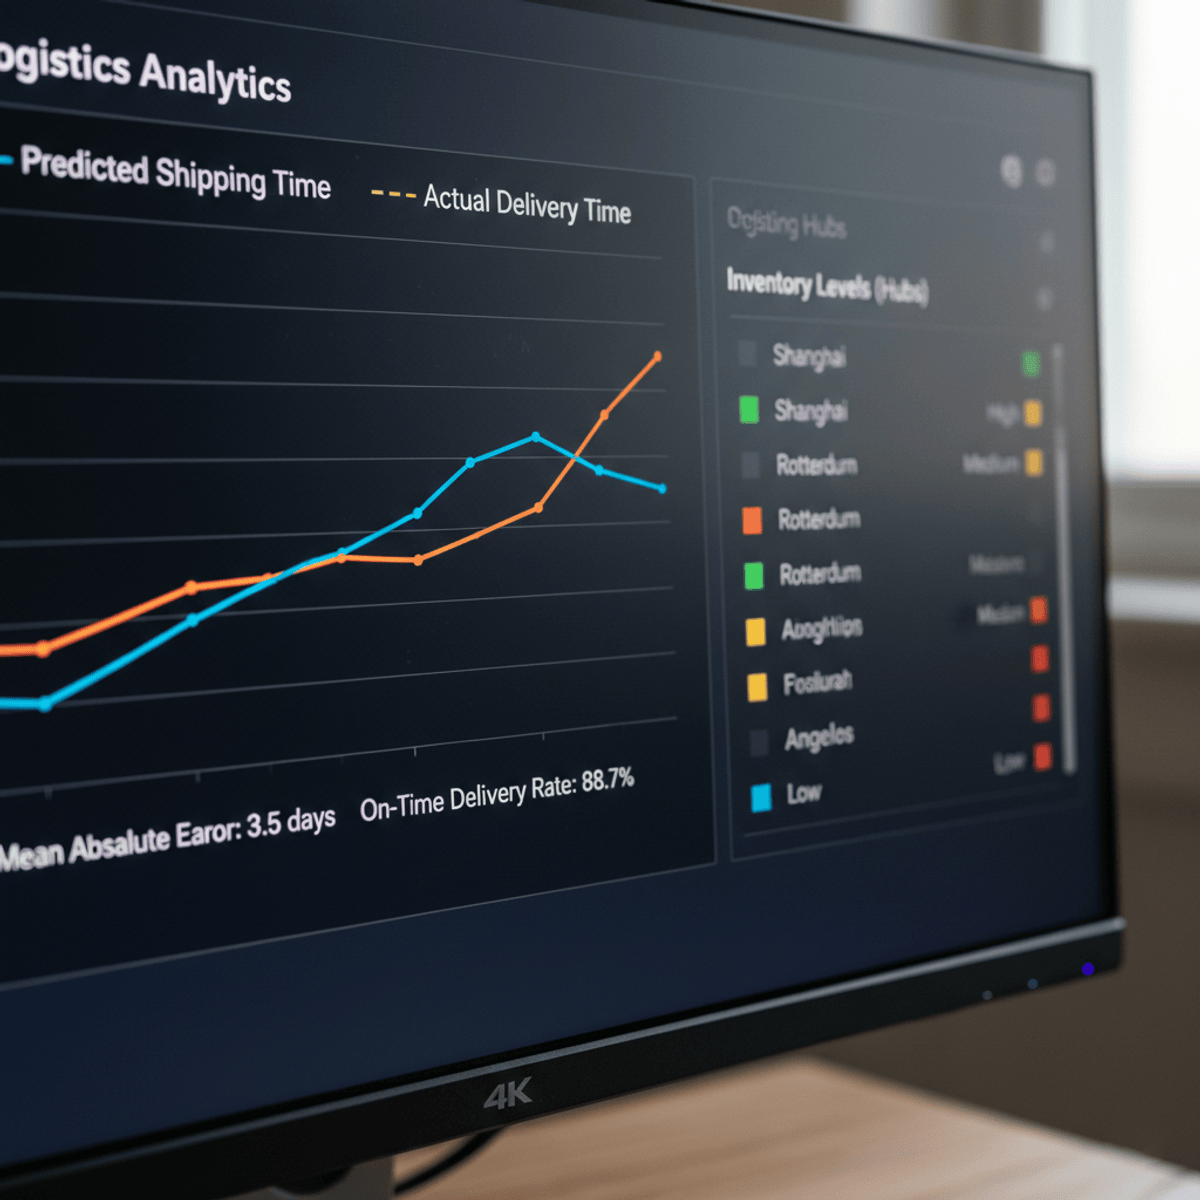


Related AI Lessons
⚡
⚡
⚡
⚡
Pandas and Data Visualization Using Matplotlib and Seaborn
Dev.to · Joseous Ng'ash
The Data Engineer’s Job Is Changing Faster Than Anyone Admits — Here’s What’s Actually Coming in…
Medium · AI
Pandas vs Polars vs DuckDB 2026: I Processed 1 Million Rows in FastAPI (Pandas Crashed My RAM…
Medium · AI
Pandas vs Polars vs DuckDB 2026: I Processed 1 Million Rows in FastAPI (Pandas Crashed My RAM…
Medium · Machine Learning
🎓
Tutor Explanation