Exploratory Data Analysis With Python and Pandas
Key Takeaways
Performs Exploratory Data Analysis with Python and Pandas to conduct univariate, bivariate, and correlation analysis and handle missing data
Original Description
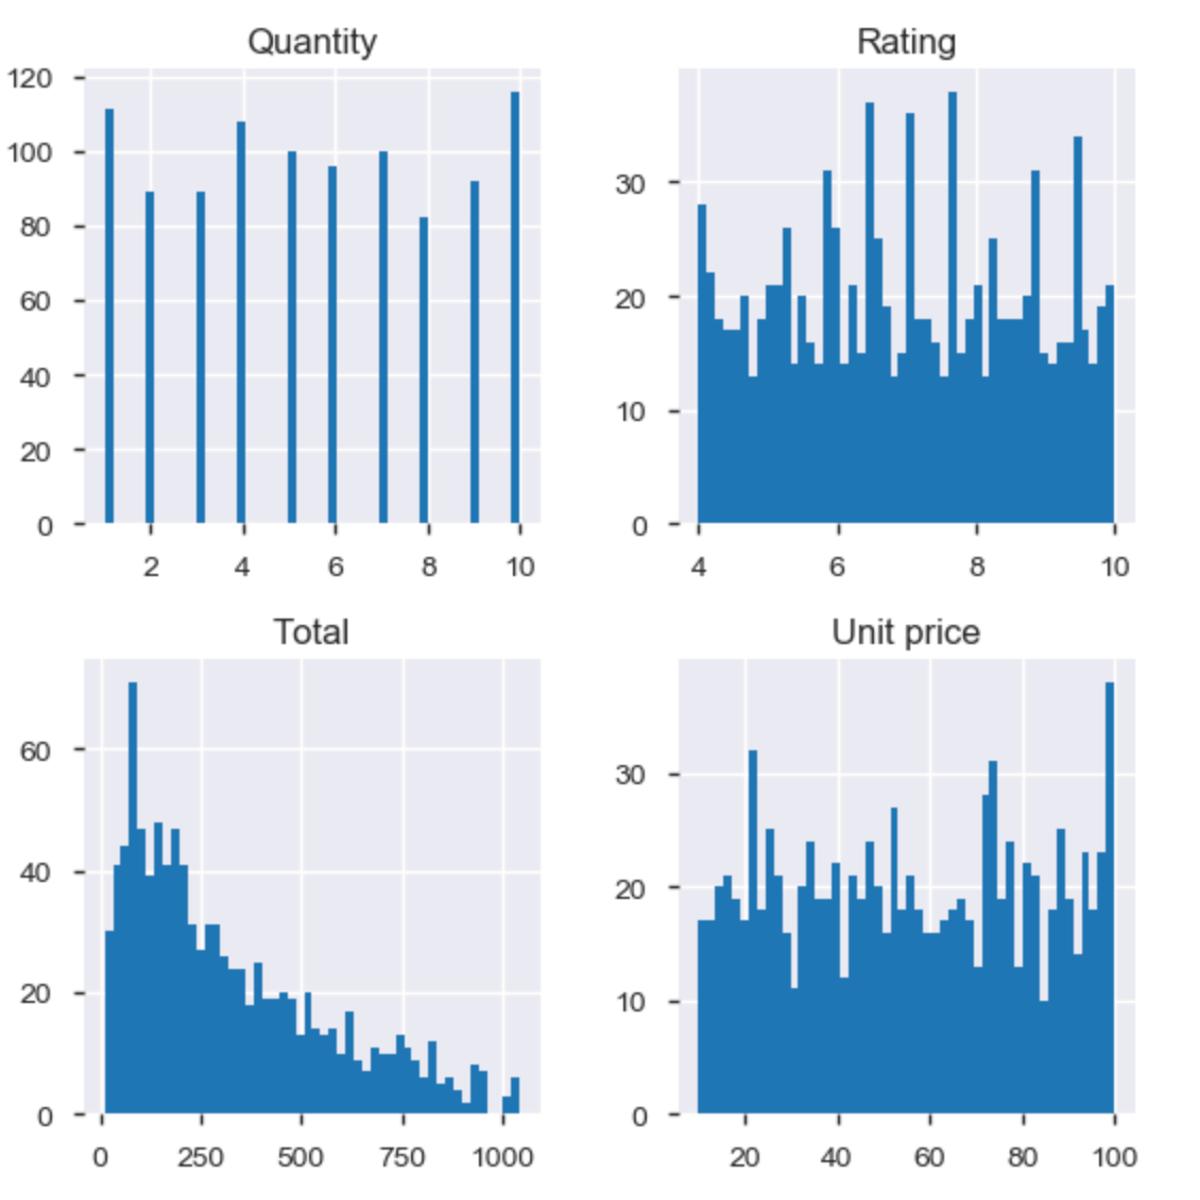
In this 2-hour long project-based course, you will learn how to perform Exploratory Data Analysis (EDA) in Python. You will use external Python packages such as Pandas, Numpy, Matplotlib, Seaborn etc. to conduct univariate analysis, bivariate analysis, correlation analysis and identify and handle duplicate/missing data.
Note: This course works best for learners who are based in the North America region. We’re currently working on providing the same experience in other regions.
AI explanation not available for this lesson yet
This lesson is still being prepared for the AI tutor. In the meantime, explore lessons that are ready.
Browse explainer-ready lessons →
More on: Data Literacy
View skill →









Related Reads
📰
📰
📰
📰
Selection Bias Correction in Retail Intelligence
ArXiv cs.AI
Decoding Workforce Dynamics: An In-Depth HR Analytics & EDA Case Study
Medium · Python
Kestra vs dbt: Which Data Tool Should You Choose
Medium · Data Science
How to Build a Clean Earthquake Dataset from the USGS Catalog (No API Key Required)
Medium · Data Science
🎓
Tutor Explanation

 DeepCamp AI