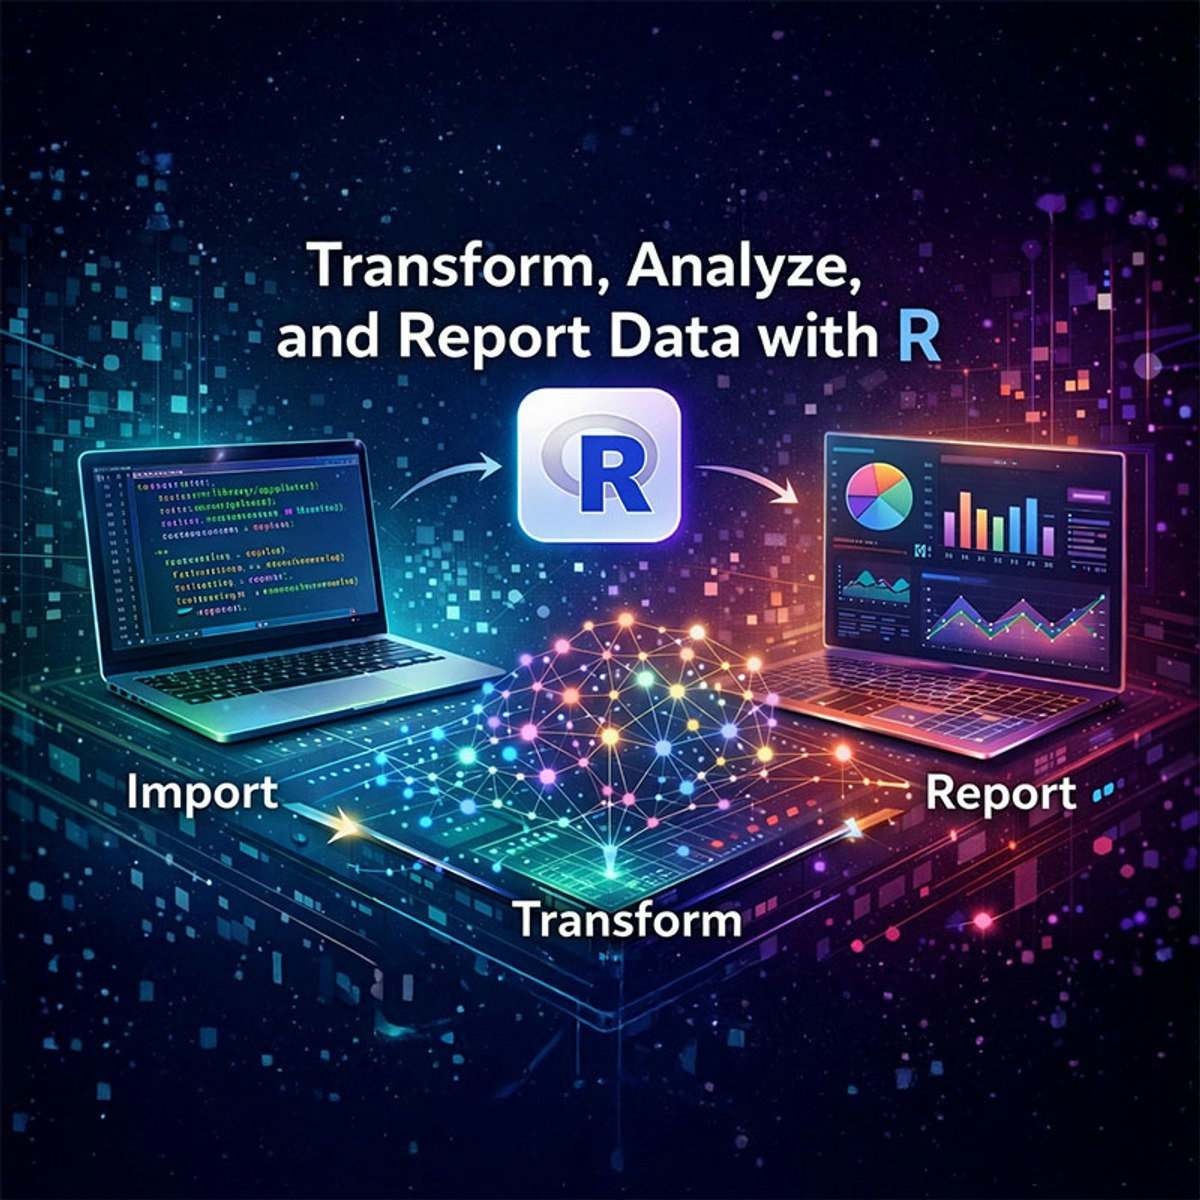
Transform, Analyze, and Report Data with R
Key Takeaways
Uses R and the Tidyverse approach to transform, analyze, and report data
Original Description
This beginner-level course is your entry into the world of robust, scalable data analysis with R. Designed for aspiring analysts, you will learn to build sophisticated, end-to-end projects from the ground up. You'll master the "Tidyverse" approach, using dplyr to write clean, pipe-based workflows that merge, filter, and prepare complex raw data for analysis.
You will also master automation—the hallmark of a modern analyst. Using R Markdown and knitr, you'll transform static scripts into dynamic reports that automatically update visualizations with new data. Finally, you'll dive into data science by rigorously evaluating predictive models with diagnostic tools such as ROC curves and cross-validation. Through hands-on learnings, you'll leave with a portfolio-ready project and the ability to build efficient, reproducible workflows. No prior R experience is necessary.
Watch on External: Coursera ↗
(saves to browser)
Sign in to unlock AI tutor explanation · ⚡30
More on: Data Literacy
View skill →









Related Reads
📰
📰
📰
📰
AI-Ready Infrastructure: A Checklist Before You Scale
Dev.to AI
How I Cut My OpenAI Bill by 97% — The Full Migration Guide
Dev.to · rarenode
Your Website Passed Claude’s Search Test. It Might Still Fail the Other Two
Medium · AI
AI Made Creation Free. Taste Is What's Scarce Now
Forbes Innovation
🎓
Tutor Explanation

 DeepCamp AI