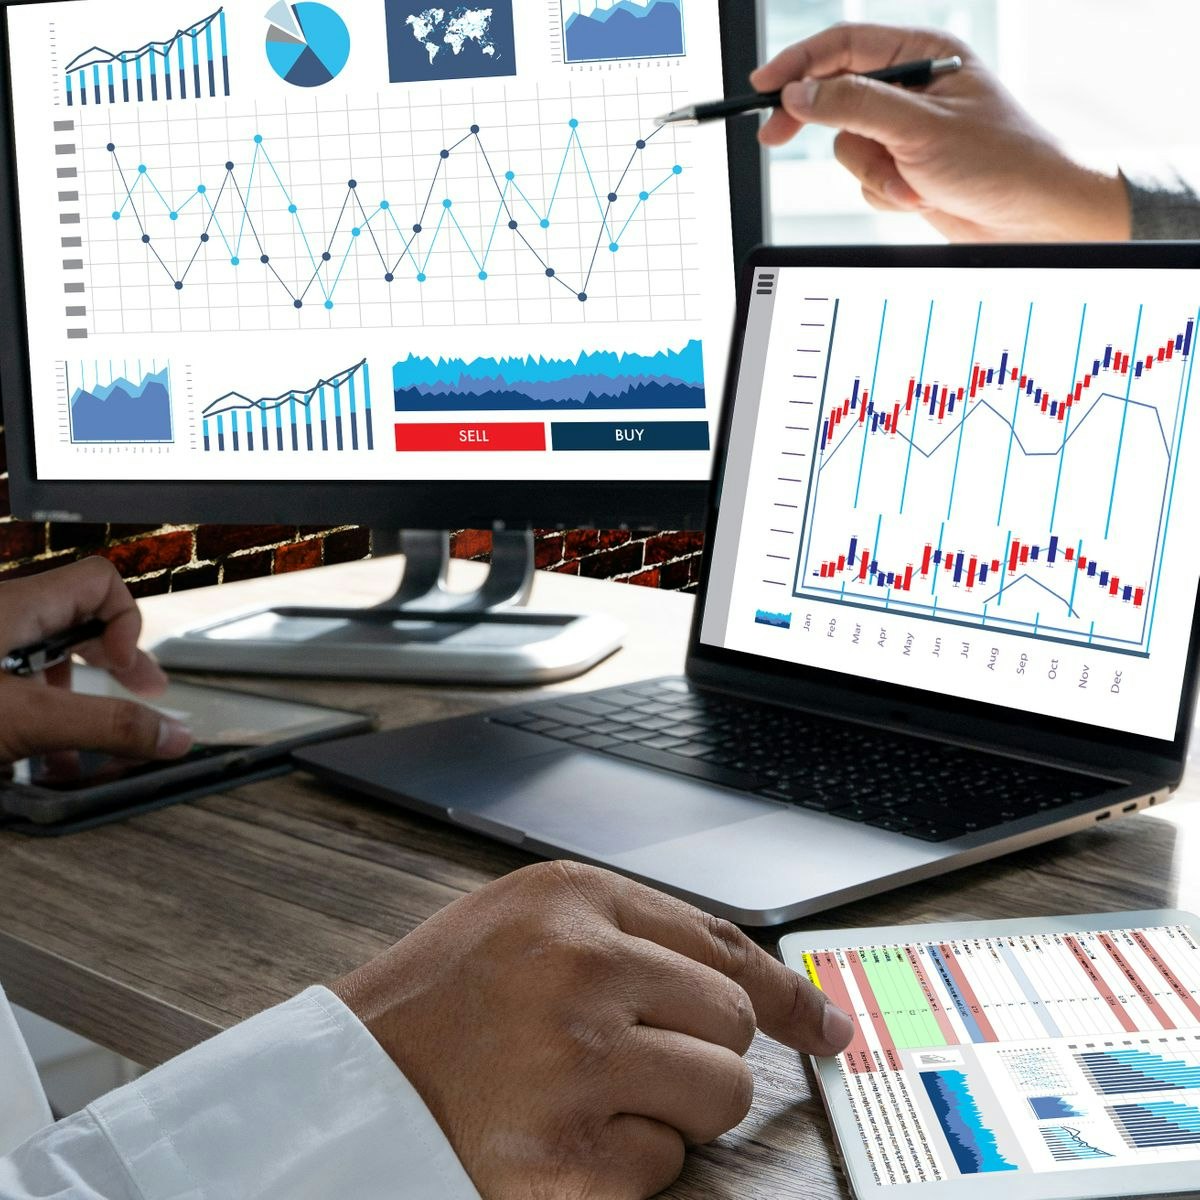
Data Analysis and Visualization
Skills:
Data Literacy80%
Key Takeaways
Covers data analysis and visualization tools, including R, Minitab, MATLAB, and Python, for a data-driven culture
Original Description
By the end of this course, learners are provided a high-level overview of data analysis and visualization tools, and are prepared to discuss best practices and develop an ensuing action plan that addresses key discoveries. It begins with common hurdles that obstruct adoption of a data-driven culture before introducing data analysis tools (R software, Minitab, MATLAB, and Python). Deeper examination is spent on statistical process control (SPC), which is a method for studying variation over time. The course also addresses do’s and don’ts of presenting data visually, visualization software (Tableau, Excel, Power BI), and creating a data story.
Material features online lectures, videos, demos, project work, readings and discussions. This course is ideal for individuals keen on developing a data-driven mindset that derives powerful insights useful for improving a company’s bottom line. It is helpful if learners have some familiarity with reading reports, gathering and using data, and interpreting visualizations. It is the second course in the Data-Driven Decision Making (DDDM) specialization. To learn more about the specialization, check out a video overview at https://www.youtube.com/watch?v=Oi4mmeSWcVc&list=PLQvThJe-IglyYljMrdqwfsDzk56ncfoLx&index=11.
Watch on External: Coursera ↗
(saves to browser)
Sign in to unlock AI tutor explanation · ⚡30
More on: Data Literacy
View skill →









Related Reads
📰
📰
📰
📰
Python for Data Science — Sampling and Why Your Conclusions Can Be Wrong
Medium · Data Science
Sleep-stage detection is mostly inference. Be honest about it.
Dev.to · SleepTrace
Data Science Institute in Tilak Nagar — AI, ML & Python Training
Medium · Data Science
From Satellite Images to Smarter Air Quality Predictions: The Story Behind AIRSENSE
Medium · Data Science
🎓
Tutor Explanation

 DeepCamp AI