Create Interactive Dashboards with Streamlit and Python
Key Takeaways
Creates interactive dashboards with Streamlit and Python
Original Description
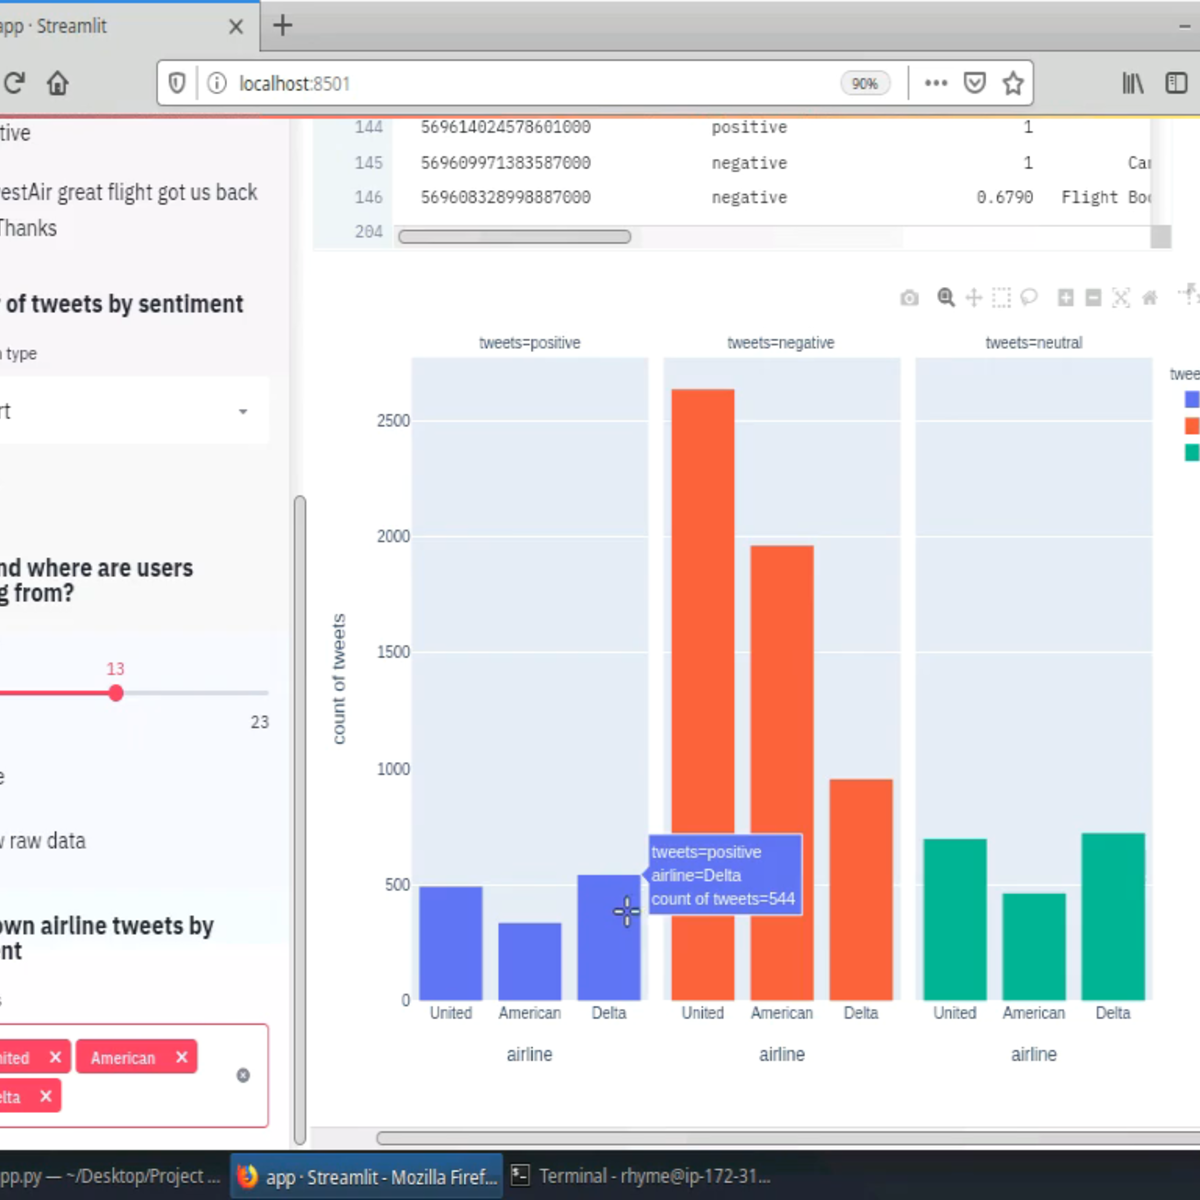
Welcome to this hands-on project on building your first interactive, data dashboard with the Streamlit library in Python. By the end of this project, you are going to be comfortable with using Python and Streamlit to build beautiful and interactive dashboards and web apps, all with zero web development experience! We are going to load, explore, visualize and interact with data, and generate dashboards in less than 150 lines of Python code!
Prior experience with writing simple Python scripts and using pandas for data manipulation is recommended.
Note: This course works best for learners who are based in the North America region. We’re currently working on providing the same experience in other regions.
Watch on External: Coursera ↗
(saves to browser)
Sign in to unlock AI tutor explanation · ⚡30
Related Reads
📰
📰
📰
📰
12.4 Million US Business Registrations Are Sitting on State Open-Data Portals, Free
Dev.to · Brad Ju
Mau Naik Level? Ini Advanced Data Science Techniques untuk Data Analytics
Medium · Data Science
I Finally Understood AWS Data Pipelines After Following a Single Customer Click
Dev.to · Anupa Supul
Beyond the Basics: Streamlit, Dash, and Bokeh for Interactive Dashboards
Dev.to · RoyserVillanueva
🎓
Tutor Explanation

 DeepCamp AI