Create a Gantt Chart with Lucidchart
Skills:
PM Basics80%
Key Takeaways
Creating a Gantt chart with Lucidchart for project management
Original Description
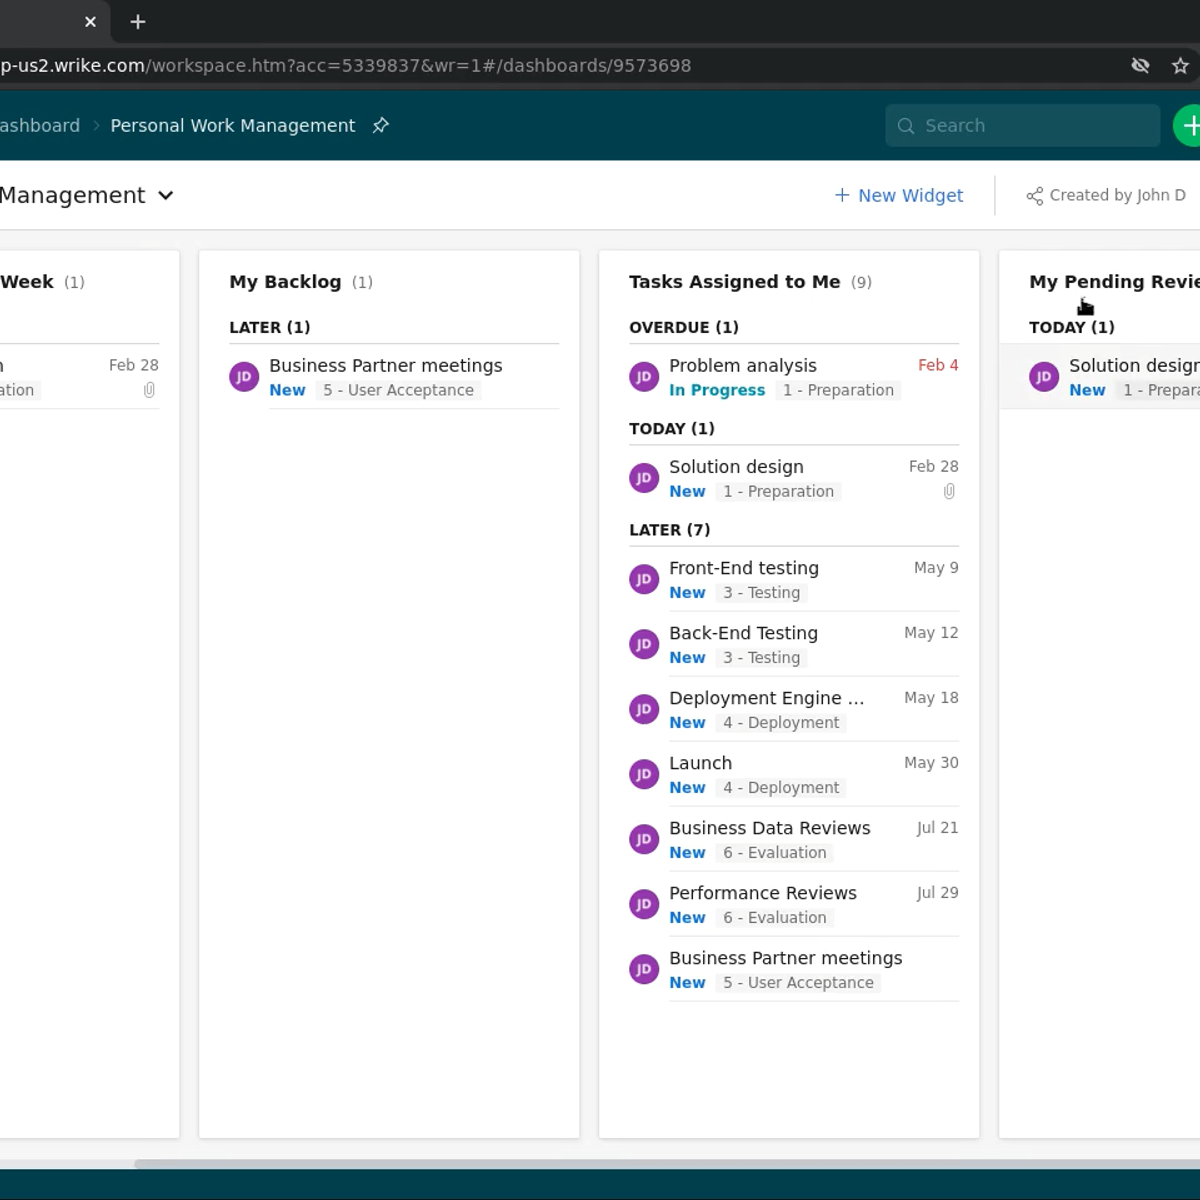
The Gantt chart is a popular project management tool that is used to display a project plan in a graphic format. In this project you will use Lucidchart software to generate a Gantt chart that includes a schedule of activities/tasks for a fictional application development project. Those tasks may overlap and/or depend on other tasks. Project managers rely on Gantt charts to plan projects and to assess project progress as time elapses.
Watch on External: Coursera ↗
(saves to browser)
Sign in to unlock AI tutor explanation · ⚡30
More on: PM Basics
View skill →


Related Reads
📰
📰
📰
📰
How Dev Agencies Can Handle Client Revisions Without Burning Out (or Losing Money)
Dev.to · SarasG
Give a Dead Side Project an Exit Report, Not an AI Eulogy
Dev.to · Sam Rivera
How I’d Scope a Project Before Writing a Single Line of Code
Medium · Startup
Where to Start with my Project Idea
Reddit r/learnprogramming
🎓
Tutor Explanation