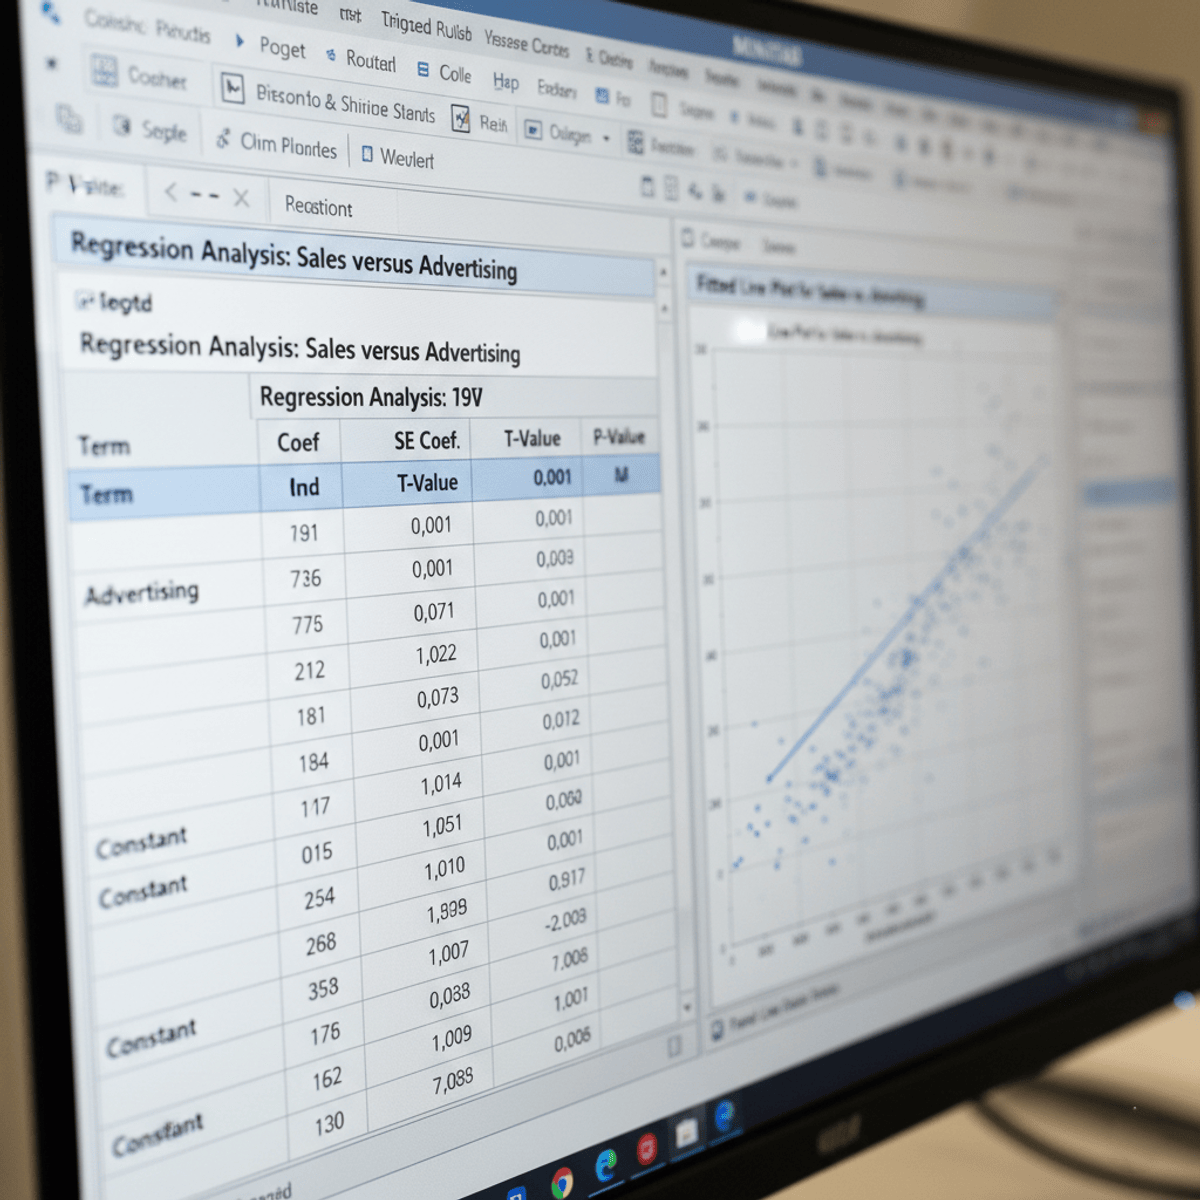
Analyze Predictor Impact Using Regression in Minitab
Key Takeaways
Analyzes predictor impact using regression in Minitab, interpreting regression outputs and translating statistical findings into business insights
Original Description
By the end of this course, learners will be able to analyze how multiple predictors influence a response variable, interpret regression outputs using Minitab, compare alternative regression models, and translate statistical findings into actionable business insights. Learners will develop the ability to evaluate predictor significance, visualize relationships, and select appropriate regression models to support data-driven decision-making.
This course provides a practical, hands-on approach to regression analysis through a real-world Tech Mahindra case study. Rather than focusing on theory alone, learners work step-by-step through an end-to-end analytics project—starting from problem framing and exploratory analysis to model refinement and comparison. Using Minitab, learners gain experience interpreting regression coefficients, p-values, and visual diagnostics such as scatter plots to understand predictor–response relationships.
What makes this course unique is its strong business orientation and project-based structure. Learners not only build and compare linear and quadratic regression models but also learn how to justify model choices based on both statistical performance and business relevance. This course is ideal for professionals and students seeking to strengthen applied regression skills and confidently use Minitab for real-world analytical challenges.
Watch on External: Coursera ↗
(saves to browser)
Sign in to unlock AI tutor explanation · ⚡30
More on: Data Literacy
View skill →









Related Reads
📰
📰
📰
📰
Classroom vs Online Data Science Training in Hyderabad | Coding MastersClassroom vs Online Data…
Medium · Data Science
SciDraw Alternative: Paper Banana for Scientific Figures
Medium · Data Science
“Missão: Risco da Carteira”.
Medium · Data Science
When Ten Analysts Agree and Two Are Right — What Numbers 13 Knew About Groupthink
Medium · AI
🎓
Tutor Explanation

 DeepCamp AI