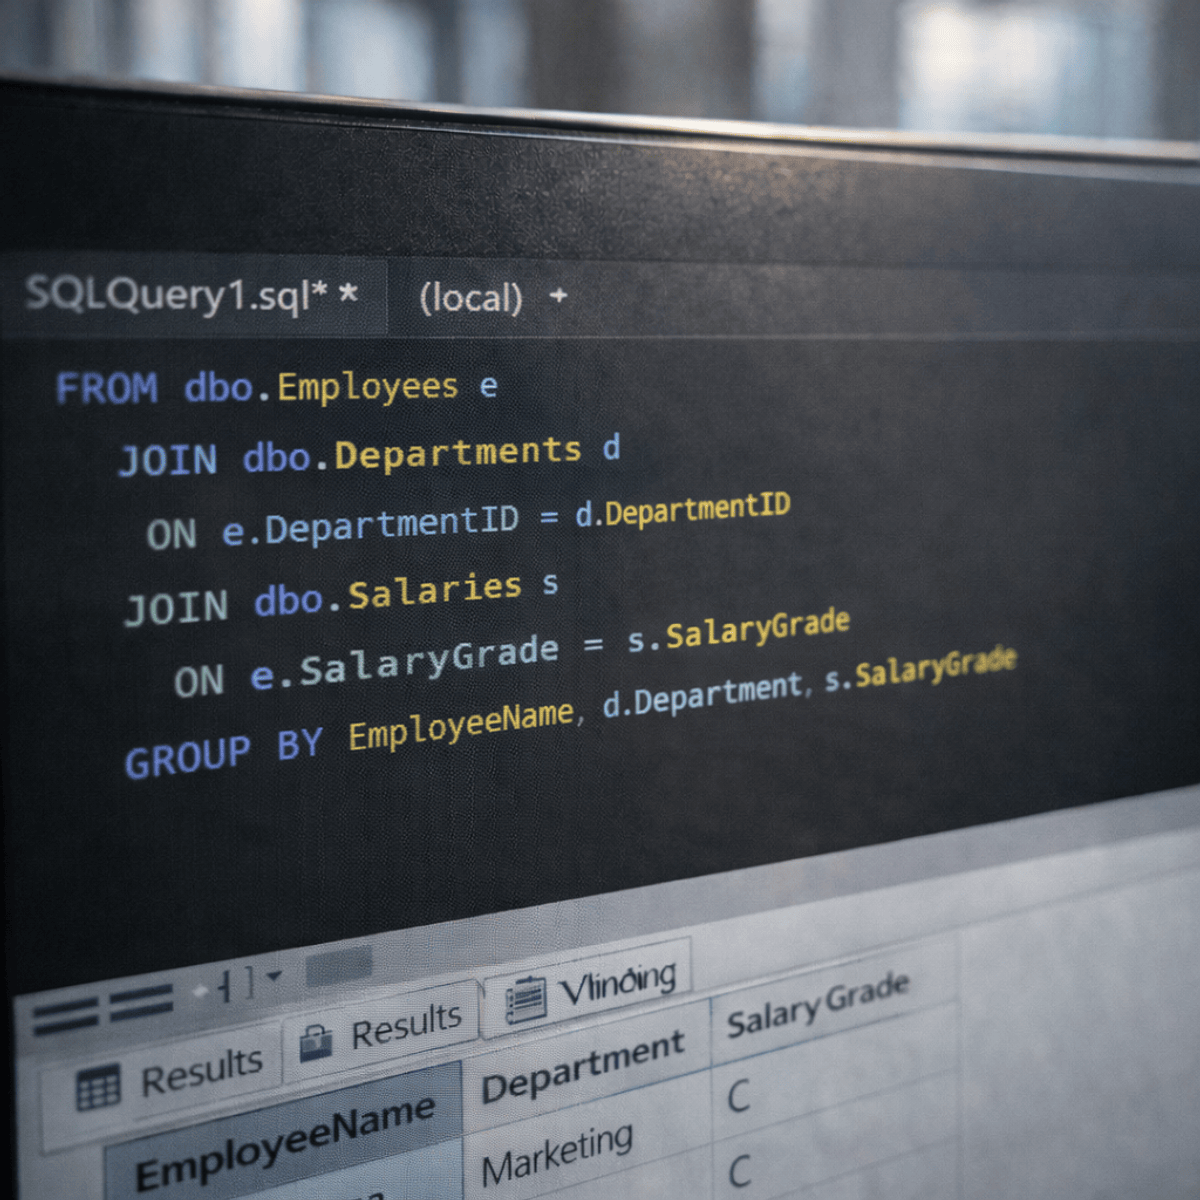
Analyze Employee Databases Using MS SQL Server
Key Takeaways
Analyzes employee databases using MS SQL Server and advanced SQL queries
Original Description
Learners will develop the ability to design, query, analyze, and optimize an employee database using MS SQL Server through hands-on, project-based learning. By the end of this course, learners will be able to create relational database structures, retrieve and filter data using advanced SQL queries, apply joins and aggregations for reporting, and solve complex business problems using subqueries and correlated logic.
This course benefits learners by transforming SQL theory into practical, job-ready skills through a complete employee database project. Instead of isolated syntax examples, learners work end-to-end—from database creation and data insertion to advanced analytics such as departmental comparisons, salary grading, and performance-based insights. Each module builds progressively, reinforcing concepts with real-world use cases commonly encountered in data analyst, database developer, and business intelligence roles.
What makes this course unique is its strong focus on applied SQL problem-solving using a single, coherent case study. Learners gain confidence not just in writing SQL queries, but in thinking analytically about data, business rules, and decision-making—skills that are directly transferable to real workplace scenarios.
Watch on External: Coursera ↗
(saves to browser)
Sign in to unlock AI tutor explanation · ⚡30
More on: SQL Analytics
View skill →






Related Reads
📰
📰
📰
📰
12.4 Million US Business Registrations Are Sitting on State Open-Data Portals, Free
Dev.to · Brad Ju
Mau Naik Level? Ini Advanced Data Science Techniques untuk Data Analytics
Medium · Data Science
I Finally Understood AWS Data Pipelines After Following a Single Customer Click
Dev.to · Anupa Supul
Beyond the Basics: Streamlit, Dash, and Bokeh for Interactive Dashboards
Dev.to · RoyserVillanueva
🎓
Tutor Explanation

 DeepCamp AI