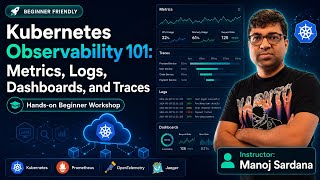
Learning Fullstack Observability: Metrics
📰 Dev.to · David
Learn full-stack observability metrics to improve system performance and debugging
Action Steps
- Define key performance indicators (KPIs) for your system using metrics
- Implement metrics collection using tools like Prometheus or New Relic
- Configure dashboards to visualize metrics and identify trends
- Test and validate metrics collection and dashboard functionality
- Apply metrics insights to optimize system performance and debugging
Who Needs to Know This
DevOps engineers and developers benefit from understanding observability metrics to monitor and optimize system performance
Key Insight
💡 Observability metrics are crucial for monitoring and optimizing system performance
Share This
📊 Improve system performance with full-stack observability metrics!
Full Article
(Originally published on Medium) Introduction According to RedHat: Observability refers...




 DeepCamp AI